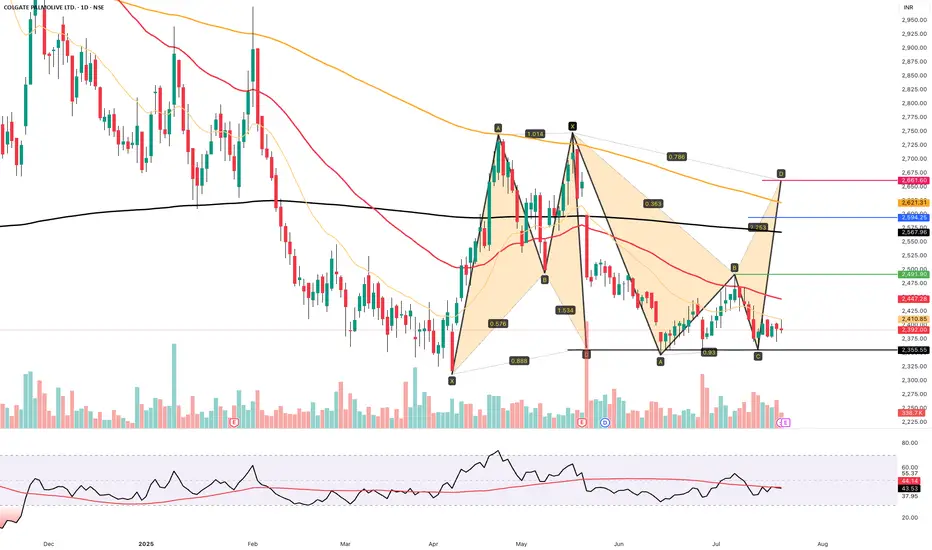
COLPAL 2660++ TARGET SOONCOLPAL AFTER CONSOLIDATION READY FOR 15-20% upside in 1-2 months
tgt 2660+++ soon
COLPAL trade ideas
COLPAL (Swing):COLPAL (Swing):
COLPAL is getting ready for an reversal up move by breaking the past supply levels.
Script has consolidated and formed a strong base near the demand zone.
Trade offers a RR of more than 1:4.
Check out my earlier views for a better understanding.
Note: Do your own due diligence before taking any action.

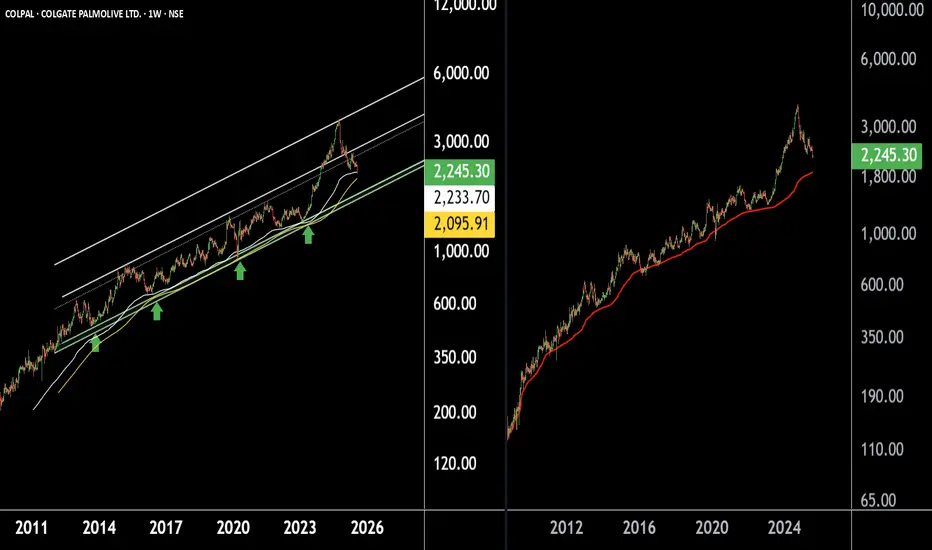
Colgate Palmolive – A Safe Haven Stock for Long-Term InvestorsThere are two chart of Colpal.
COLPAL is moving in well defined parallel channel with support near at 1750-1850.
COLPAL is taking support on Ema with near at 2050-2150.
COLPAL is taking support near its AVWAP zone, which lies between ₹1800–₹1900.
If this level is sustain then we may see higher prices in COLPAL.
Thank You !!
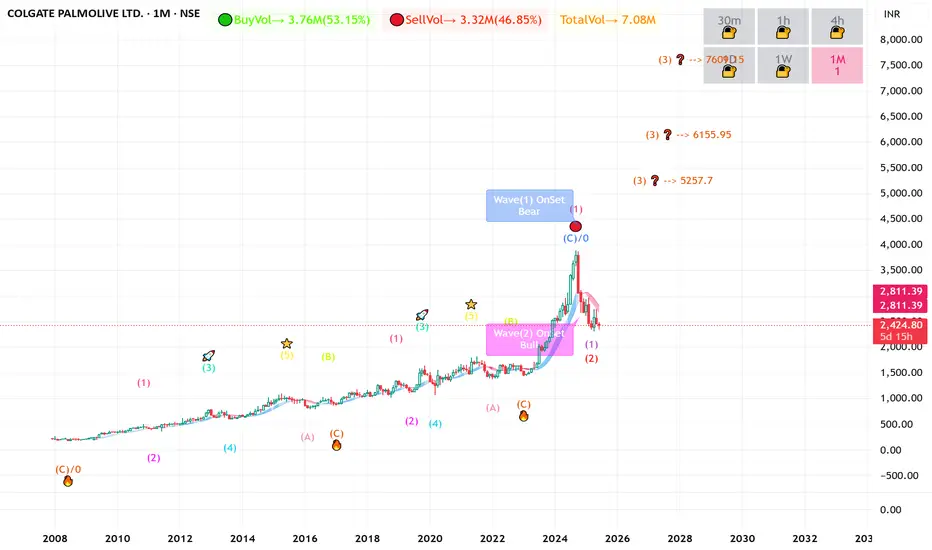
COLPAL Ready to Blast 5257 to 7601 long term investment ideaCOLPAL Monthly counts showing real good setup as per monthly counts as we can see in our chart showed to you
next grand cycle suggests its good time as buy setup formation running now
if sustain current levels on monthly basis that can ensure that counts are correct
Elliot wave theory consist multiple forecasts depends upon price action on various time degree levels
our counts may be wrong
please do your own analysis before you enter into any sort of trading
CHARTS PUBLISH to learn /understand EW method
only education based!!!
please share counts for this script
Colgate Palmolive India Ltd view for Intraday 23rd May #COLPAL Colgate Palmolive India Ltd view for Intraday 23rd May #COLPAL
Resistance 2520 Watching above 2525 for upside momentum.
Support area 2450 Below 2500 ignoring upside momentum for intraday
Watching below 2445 for downside movement...
Above 2480 ignoring downside move for intraday
Charts for Educational purposes only.
Please follow strict stop loss and risk reward if you follow the level.
Thanks,
V Trade Point

ColpalAs per the Fibonacci retracement and 200 (ema+dma) in weekly timeframe we can expect a reversal towards up side.

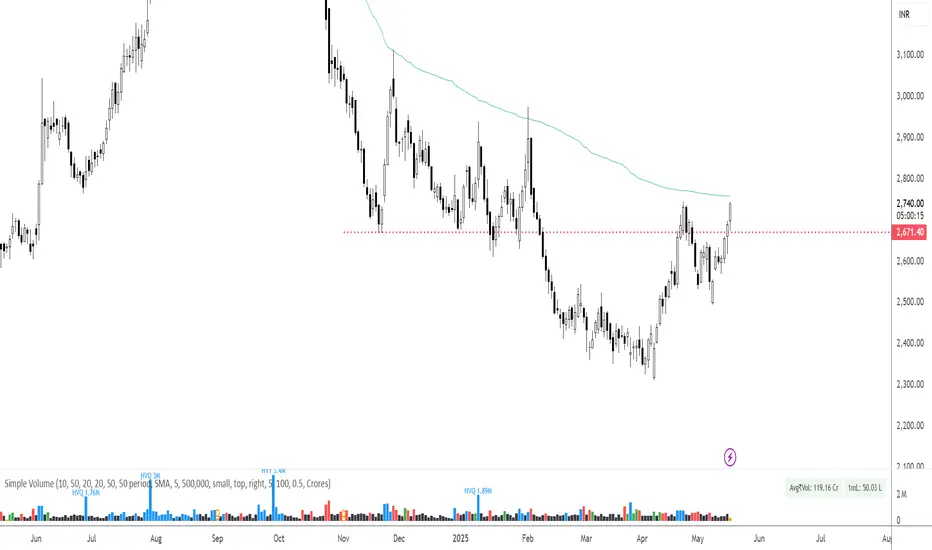
COLPAL - Descending Channel Analysis | Key Resistance RejectionColgate Palmolive (NSE: COLPAL) is trading within a well-defined descending channel on the daily chart, indicating a sustained bearish trend. The stock recently tested the upper resistance zone of the channel near 2700–2750 and faced rejection, leading to a pullback. As long as the price remains below the resistance, the downside momentum towards the support zone near 2200–2300 may continue. A strong breakout above the channel resistance could signal a potential trend reversal. Traders should watch for confirmation before positioning.

Colgate stock breakout leval Eye's open really Colgate long without risk stock fundamental strong bye on Deep investment your risk financial advisor se puch ke hi risk le minimum 25% up side ready

Neutral or sell COLPALThis is a clear case of raised valuations across most of the stocks. As seen in the Revenue Grid indicator, this stock was trading at 8 to 10 of Price to Revenue ratio, but from July 2023 it suddenly started going up and went to 18 times it's Revenue per share. Why? God knows! :)
Now naturally coming back to it's historic valuation. To get to it's fair price, within a short duration, such as couple of months, levels of 2230 can be seen. Happy Trading :)

Colgate Palmolive (India) Limited (COLGATEPALMOLIVE.10, NSE)
Trend Analysis:
Uptrend: From August to October 2024, the stock was in a clear uptrend, moving from around 2400 INR to a peak near 3400 INR. This is indicated by the series of higher highs and higher lows.
Downtrend: Post-October 2024, the stock entered a downtrend, dropping significantly until around mid-December 2024, where it found some support. This is shown by the downward slope of the price action and the breaking of support levels.
Moving Averages:
The chart includes several moving averages:
The green line (likely a longer-term moving average like the 200-day) shows a gentle upward slope, suggesting a long-term bullish trend despite the recent downturn.
The red line (possibly a 50-day moving average) and the black line (potentially a 20-day moving average) are also present. The price has crossed below these shorter-term moving averages, indicating bearish momentum in the short term.
Support and Resistance:
Support: Around 2800 INR, there's a notable support level where the price has bounced back multiple times since late December 2024. This is marked by the horizontal green line.
Resistance: The previous high near 3400 -3413 INR acts as a resistance level, which the stock failed to break through after the initial peak in October.
Volume Analysis:
Volume isn't shown in the chart, but typically, volume analysis would help confirm trends. High volume on downtrends could indicate strong selling pressure, while low volume on uptrends might suggest weak buying interest.
Gann Fan:
The chart uses a Gann Fan, which is a technical analysis tool based on the principles of W.D. Gann. The fan lines help to identify potential support and resistance levels based on geometric angles. The price has been interacting with these lines, particularly finding support at the 1x1 angle (green line) around January 2025.
Recent Activity :
As of late January 2025, the stock seems to be testing the support level again around 2800 INR. There's a small green candle indicating a slight recovery or at least a pause in the downtrend.
Indicators and Patterns:
The chart shows potential for a double bottom pattern around the 2800 level, which could be a bullish reversal pattern if confirmed by subsequent price action.
The presence of the blue circle might indicate a point of interest or a potential reversal signal based on the user's analysis.
Conclusion:
The stock has experienced a significant correction after a strong uptrend. It's currently testing a critical support level around 2800 INR. If this support holds, there could be a potential reversal or at least a consolidation phase. If it breaks below this level, further downside might be expected, targeting the next support around 2600 INR.
Investors should watch for confirmation of support or a break below it, along with volume changes and any news or events related to Colgate Palmolive India that could influence stock movement.
Remember, while technical analysis provides insights, fundamental analysis and external market conditions should also be considered for a comprehensive investment decision. If you need further analysis or real-time data, please let me know if you'd like me to search for additional information.

longThe market has recently bounced from the 50% retracement level, presenting a great opportunity for investors to enter long positions. This pullback has created an attractive entry point for those looking to position themselves for future gains. I am currently long at 2,700, with a positive outlook for the coming months and years.
If the market experiences any further drops from the current levels, the 2,400 range also provides a solid entry opportunity. This level could act as strong support, offering an ideal spot to accumulate more positions at favorable prices.

COLPALPositional Trade opportunity in COLPAL
CMP & Entry - 2737
SL - 2530
Target 1 - 3100
Target 2 - 3800
DISCLAIMER: Not financial advice. Only for educational purposes.
Invest at your own risk

COLGATE Swing Long SetupI'm watching Colgate for a potential long entry.
Here's the plan:
Entry Zone: 3548.8
Entry Price: Will take the entry only if a 15-minute candle breaks above 3548.8 . The high of that 15-minute candle will be my entry price.
Target: 3716
Stop Loss: 3465 (Stop loss will trigger only if a daily candle closes below this level)
If the entry gets confirmed, I'll aim for the target of 3716 . The stop loss is set at 3465 , but I’ll only exit if the daily close falls below that level. Until then, the setup stays active.
Disclaimer: This is for educational purposes only and not financial advice. Make sure to manage your risk and trade responsibly.

COLPAL S/R Support and Resistance Levels:
Support Levels: These are price points (green line/shade) where a downward trend may be halted due to a concentration of buying interest. Imagine them as a safety net where buyers step in, preventing further decline.
Resistance Levels: Conversely, resistance levels (red line/shade) are where upward trends might stall due to increased selling interest. They act like a ceiling where sellers come in to push prices down.
Breakouts:
Bullish Breakout: When the price moves above resistance, it often indicates strong buying interest and the potential for a continued uptrend. Traders may view this as a signal to buy or hold.
Bearish Breakout: When the price falls below support, it can signal strong selling interest and the potential for a continued downtrend. Traders might see this as a cue to sell or avoid buying.
20 EMA (Exponential Moving Average):
Above 20 EMA(50 EMA): If the stock price is above the 20 EMA, it suggests a potential uptrend or bullish momentum.
Below 20 EMA: If the stock price is below the 20 EMA, it indicates a potential downtrend or bearish momentum.
Trendline: A trendline is a straight line drawn on a chart to represent the general direction of a data point set.
Uptrend Line: Drawn by connecting the lows in an upward trend. Indicates that the price is moving higher over time. Acts as a support level, where prices tend to bounce upward.
Downtrend Line: Drawn by connecting the highs in a downward trend. Indicates that the price is moving lower over time. It acts as a resistance level, where prices tend to drop.
RSI: RSI readings greater than the 70 level are overbought territory, and RSI readings lower than the 30 level are considered oversold territory.
Combining RSI with Support and Resistance:
Support Level: This is a price level where a stock tends to find buying interest, preventing it from falling further. If RSI is showing an oversold condition (below 30) and the price is near or at a strong support level, it could be a good buy signal.
Resistance Level: This is a price level where a stock tends to find selling interest, preventing it from rising further. If RSI is showing an overbought condition (above 70) and the price is near or at a strong resistance level, it could be a signal to sell or short the asset.
Disclaimer:
I am not a SEBI registered. The information provided here is for learning purposes only and should not be interpreted as financial advice. Consider the broader market context and consult with a qualified financial advisor before making investment decisions.

COLGATE! Time to shine??- Colgate gave a good breakout which was met by a long upper wick candle showing the presence of sellers at the crucial resistance zone.
- The price is now trying to break it. The structure does look good but given the volatility just after the breakout, it will be wise to wait for a break and sustenance of the price above the zone.
What are your thoughts? Leave us a comment.
Disclaimer: Please note that we are not registered advisors and the views expressed here are solely personal opinions. We strongly recommend consulting with your financial advisors before making any investment decisions. We like everybody else, have the right to be wrong.:)

Colgate can shine your portfolio and Teeth. Colgate-Palmolive (India) Limited is an MNC India's leading provider of scientifically proven oral care products. The range includes toothpastes, toothpowder, toothbrushes and mouthwashes under the 'Colgate' brand, as well as a specialized range of dental therapies under the banner of Colgate Oral Pharmaceuticals. The Company is engaged in manufacturing/ trading of toothpaste, tooth powder, toothbrush, mouthwash and personal care products. It also provides a range of personal care products under the `Palmolive' brand name.
The positive aspects of the company are Company with No Debt, Mutual Funds Increased Shareholding in Past Month, Company with Zero Promoter Pledge and MFs increased their shareholding last quarter. The Negative aspects of the company are High P.E. Ratio=55.5, RSI indicating price weakness and Recent Broker Downgrades in Reco or Target Price.
Entry can be taken after closing above 2709. Targets in the stock will be 2735, 2765 and 2827. The long-term target in the stock will be 2877, 2920 and 2961. Stop loss in the stock should be maintained at Closing below 2642.
The above information is provided for educational purpose, analysis and paper trading only. Please don't treat this as a buy or sell recommendation for the stock. We do not guarantee any success in highly volatile market or otherwise. Stock market investment is subject to market risks which include global and regional risks. We will not be responsible for any Profit or loss that may occur due to any financial decision taken based on any data provided in this message.

Lapu Star BreakoutA cup and handle price pattern on a security's price chart is a technical indicator that resembles a cup with a handle, where the cup is in the shape of a "u" and the handle has a slight downward drift.
The cup and handle is considered a bullish signal, with the right-hand side of the pattern typically experiencing lower trading volume. The pattern's formation may be as short as seven weeks or as long as 65 weeks.

breakout on reversalday high target on COLPAL after rejection on support along with matching low candle.. testing only
views are personal and not advise. DYOR

Colpal signaling a bullish trendColpal breaks out above 2750, signaling a bullish trend. Traders eye a target of 2900, anticipating continued upward momentum

Colpal Breakout Target and Stoploss MentionedThe investments discussed or recommended in the market analysis, research reports, etc. may not be suitable for all investors. Investors must make their own investment decisions based on their specific investment objectives and financial position and only after consulting such independent advisors as may be necessary.

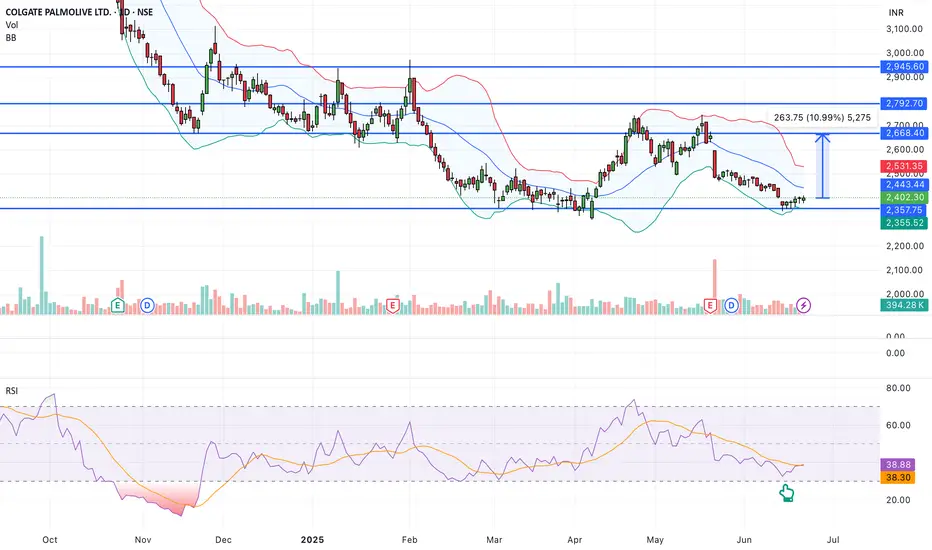
Keep An Eye - COLPAL📊 Script: COLPAL
📊 Sector: FMCG
📊 Industry: Personal Care - Multinational
Key highlights: 💡⚡
📈 Script is trading at upper band of BB.
📈 MACD is giving crossover .
📈 Double Moving Averages is giving crossover.
📈 Stock is under Consolidation Zone highlighted into chart breakout is above 2624 level.
📈 Right now RSI is around 60.
📈 One can go for Swing Trade only above 2624.
BUY ONLY ABOVE 2624
⏱️ C.M.P 📑💰- 2606
⚠️ Important: Always maintain your Risk & Reward Ratio.
✅Like and follow to never miss a new idea!✅
Disclaimer: I am not SEBI Registered Advisor. My posts are purely for training and educational purposes.
Eat🍜 Sleep😴 TradingView📈 Repeat 🔁
Happy learning with trading. Cheers!🥂
