DIVIS LAB SEllDIVIS LAB SEll for day trading if stock and pharma sector also weak then we will enter in trade,.....
DIVISLAB trade ideas
DIVIS LAb BuyDIVIS LAb Buy for day trading if stock and pharma sector also bullish then we will enter in trade....

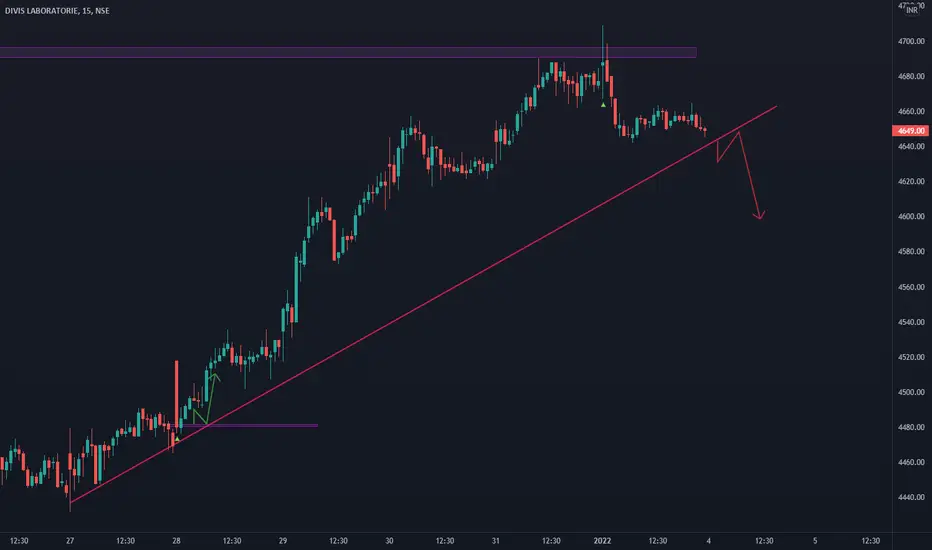
DIVISLAB ANALYSISCup and Handle Pattern and 0.382fib-level break
Make or Break Zone:4663-4691
Upside Targets:4719,4804
Below 4632 DIVISLAB is weak

divis lab - expected behaviour on weekly chartthe reference of this chart is purely for educational purpose.

DIVISLAB BuyDIVIS LAB Buy for day trading if stock and pharma sector also strong then we will enter in trade...
DIVIS LABHello
A warm welcome on this Ichimoku analysis on DIVIS LAB
Currently stock in a no fresh trade zone. Key levels to watch either below 4400 or above 4525

DIVISLAB - Reveral of polarityDIVISLABS - Reversal of polarity.
After a 20% drawdown, the stock seems to have found a bottom.
One can go long with a SL of 200 ema or last swing low.

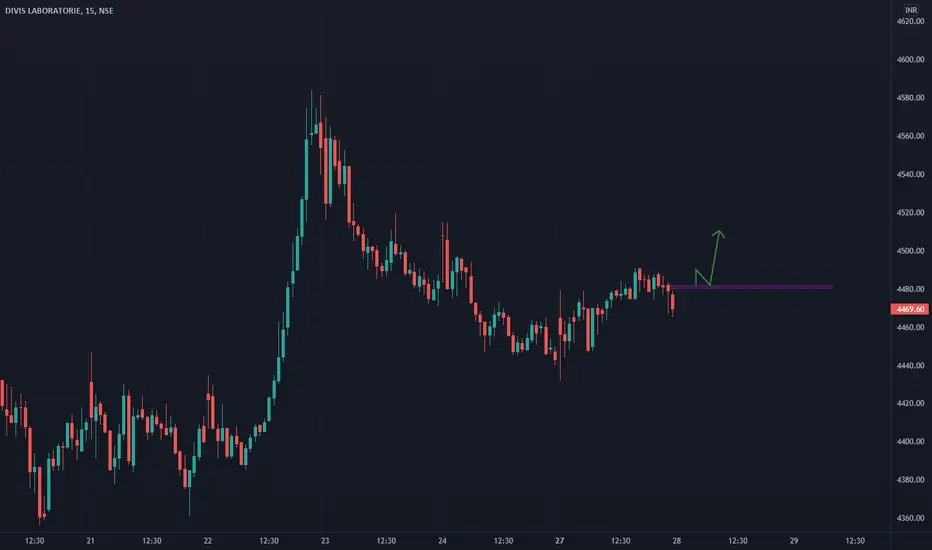
Trade divis lab only if it opens flat or gap down!Stock has moved consistently in a downward channel and it has started the upmove from swing low. Though stock is in down trend, the upmoves in this stock are always fast.
Expecting a target of 4782 tomorrow itself, which is the channel resistance.
Entry: strictly below 4575 (otherwise the RR is not favourable)
SL : below the broken trendline at 4380
Trail the SL if trendline is broken and hold positionally. Else book profits in intraday.
*educational purposes only*

H&S in DIVISLAB. Keep an eye for potential downside.BSE:DIVISLAB has formed a H&S pattern. It broken down and did a pullback too. Now a red candle closing below the neckline (blue line) in daily could be a good shorting opportunity for a short term target of around 4000 and lower. Keep an eye!

Divi's Labs India Sun Storm Investment Trading Desk & NexGen Wealth Management Service Present's: SSITD & NexGen Portfolio of the Week Series
Focus: Worldwide
By Sun Storm Investment Research & NexGen Wealth Management Service
A Profit & Solutions Strategy & Research
Trading | Investment | Stocks | ETF | Mutual Funds | Crypto | Bonds | Options | Dividend | Futures |
USA | Canada | UK | Germany | France | Italy | Rest of Europe | Mexico | India
Disclaimer: Sun Storm Investment and NexGen are not registered financial advisors, so please do your own research before trading & investing anything. This is information is for only research purposes not for actual trading & investing decision.
#debadipb #profitsolutions

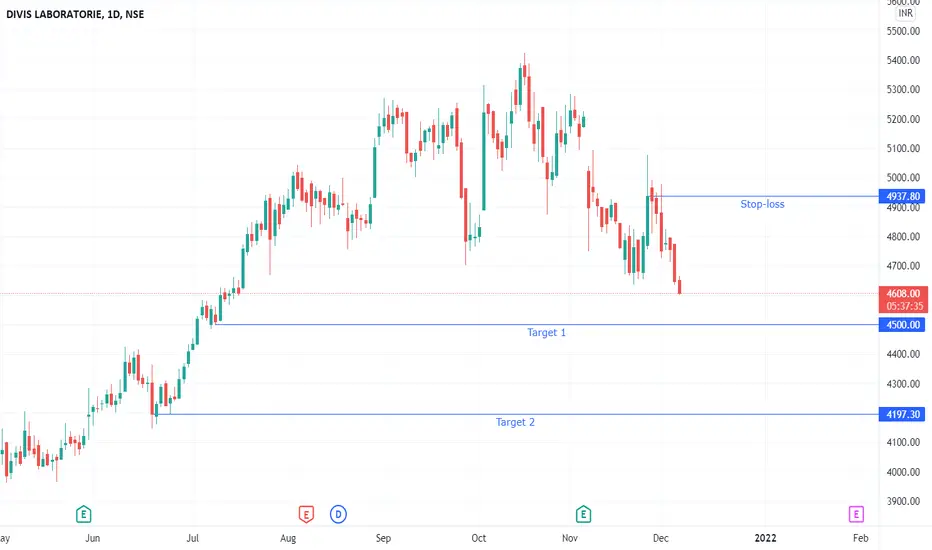
Divis lab would fall moreSince it has broke it's major support, which is located @4675, there is a probability that it would fall down below to 4500.
Note - Above ideas is for study purpose only. Please consult your financial advisor before taking any position

DIVISLAB - Price Action Analysis Currently, BSE:DIVISLAB having witness of tremendous selling pressure for last couple of week and creates bullish harmonic Shark pattern with the PRZ (Prize Reversal Zone) level 0.886 at price 4317.
BUY : buying only happens when price will touch at the Demand zone (4196-4336) and making confirmation candle.
SELL : Our target would be up to supply zone (4728-4831) and any reversal sign at that zone also creating short opportunity as well.
Those who takes buy opportunity also creating SL in between the range of 3932-3800. you can easily get 1:1 or 1:2 risk and reward.

DIVISLAB | Bullish setupPrice is likely to show some bullishness. This will be Retracement and it is a part of HTF trend reversal.


Divislab positional and intraday momentum tradeDivislab analysis view is bullish and break reverse head and shoulder pattern resistance

DIVISLAB BreakoutInverted Head and shoulder breakout
SL- around 6 percent (below right shoulder)
Entry at CMP
I don't think anymore explanation is required -chart is Self-explanatory
#LearnInPublic

Divis lab Channel BOHorizontal channel BO but volume is not enough or above 20 EMA.
If closed above 5373 with volume then it can move further.
CMP=5372

DIVIS LAB looking good for up side moveDIVIS lab is looking strong for up side move. We can consider 3 to 5% intraday move.

DIVISLAB TARDE IDEADIVISLAB very good buy above 5385 for posional target of 5400+/ 5500+
its HEAD & SHOULDER brekout in 1 day time frame and we can entry in 1 hr time frame clear brekout of POLE & FLAG pattern brekout with volume as well try to grab on by monday.
NSE:DIVISLAB

