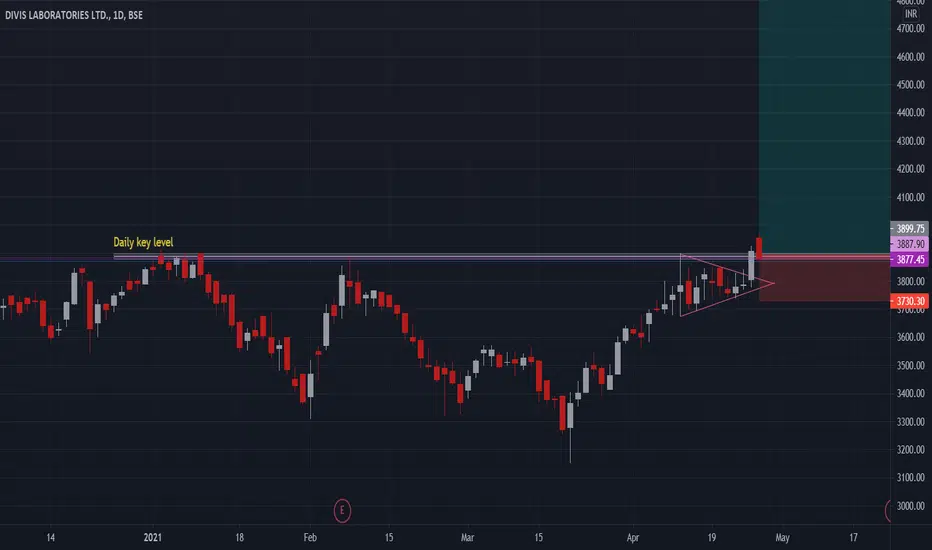
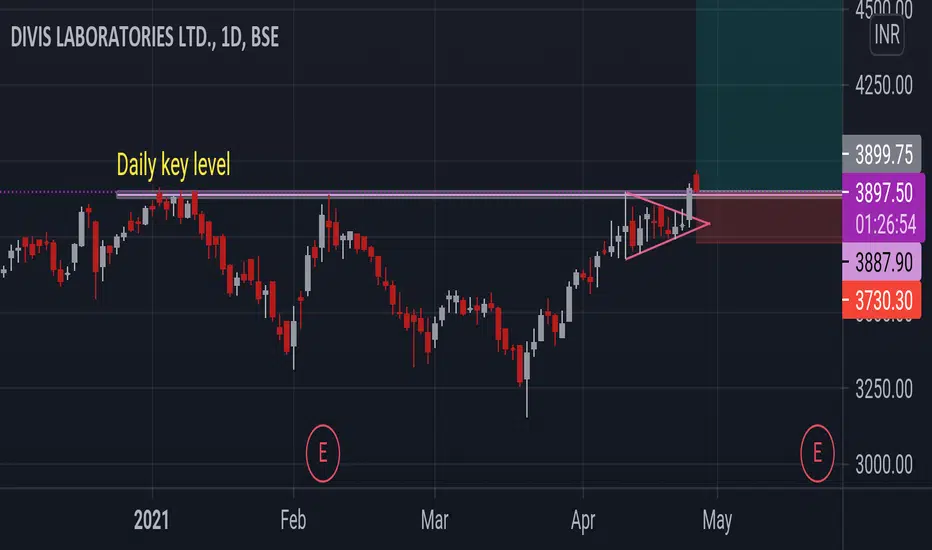
#DIVISLABAscending triangle pattern breakout coming , RSI around 60 , wait for relative strength for confirmation
DIVISLAB trade ideas

DIVISLABDIVISLAB loooks bullish .potential reversal zone 4816-4820 ..anybody in lifetime losss u can trade this idea with ur confirmations tooo#team spartanz


DIVISLAB : Possible downside further DIVISLAB:
On 24thSep- we can see Reversal on low volume
On 27thSep - 3.5% down with strong volume
Breaking monthly CPR,
Next target 4829 - once breaks and sustains - will test 4678.
Please add to watch list and trade carefully.

Divislab - Elliott wave analysis - correction downit looks like finished the impulse up and now correcting the move down and below 4757 it confirms the correction down

Divislab - Elliott wave analysis - 5th wave up It is in 5th of 5th wave and soon it will end the cycle within uptrending channel. Then it should correct down at least around 4800 or even lower.

Divislab - Elliott wave analysis - 5th wave upIt is in 5th of 5th wave and bullish above 4757.25. The target zone is between 5093-5358.

Magic
//@version=3
//
study(title = "Magic Trading Tool", shorttitle = "TTSS", overlay = true)
// === INPUTS ===
ShowPAC_ = input(true, title="Show Price Action Channel (PAC)")
scolor = input(true, title="Show coloured Bars close relative on PAC")
HiLoLen = input(10,minval=2,title="High Low PAC Length")
ShowPACexit = input(false, title="Show PAC Swing Alerts")
UseBigArrows = input(false, title="Use Big Arrows for Swing Alerts")
filterEMA200 = input(true, title="Filter PAC Alerts with 200ema")
ShowEMA12_Channel= input(true)
ShowEMA36_Ribbon = input(true)
ShowPAC = HiLoLen>30 ? ShowEMA36_Ribbon? false: ShowPAC_: ShowEMA12_Channel? false : ShowPAC_
ShowPivots = input(true)
ShowPivotLabels = input(true)
// Disable Fractal drawing if Pivots enabled
ShowHHLL_ = input(false)
ShowHHLL = ShowPivots?false:ShowHHLL_
ShowFractals_= input(true)
ShowFractals = ShowPivots?false:ShowFractals_
ShowFractalLevels =input(false)
filterBW_ = input(false, title="Filter for Pristine (Ideal) Fractals")
filterBW = ShowPivots?true:filterBW_
DodgerBlue = #1E90FF
close_ = close //security(ticker, period, close, barmerge.gaps_off, barmerge.lookahead_on)
open_ = open //security(ticker, period, open, barmerge.gaps_off, barmerge.lookahead_on)
high_ = high //security(ticker, period, high, barmerge.gaps_off, barmerge.lookahead_on)
low_ = low //security(ticker, period, low, barmerge.gaps_off, barmerge.lookahead_on)
exitClose = close_ //UseHAexit ? security(heikinashi(tickerid), period, close) : close_
exitOpen = open_ //UseHAexit ? security(heikinashi(tickerid), period, open) : open_
isRegularFractal(mode) =>
ret = mode == 1 ? high_ < high_ and high_ < high_ and high_ > high_ and high_ > high_ :
mode == -1 ? low_ > low_ and low_ > low_ and low_ < low_ and low_ < low_ : false
isBWFractal(mode) =>
ret = mode == 1 ? high_ < high_ and high_ < high_ and high_ > high_ and high_ > high_ :
mode == -1 ? low_ > low_ and low_ > low_ and low_ < low_ and low_ < low_ : false
// ||-----------------------------------------------------------------------------------------------------||
// MA Colour finder for EMA Ribbon plot.
maColor(maBase, ma, maRef) =>
change(ma)>=0 and maBase>maRef ? teal
:change(ma)<0 and maBase>maRef ? maroon
:change(ma)<=0 and maBase=0 and maBase=pacU? green : close<=pacL? red : gray
barcolor(scolor?bColour:na, title = "Bar Colours")
ema05=plot(ShowEMA12_Channel?EMA05:na, color=white,linewidth=1,transp=92,title="EMA05")
ema11=plot(ShowEMA12_Channel?EMA11:na, color=blue,linewidth=1,transp=92,title="EMA11")
fill(ema05,ema11, color=gray,transp=92,title="Fill EMA5-12")
//
emaFast = isintraday? interval==1? EMA75 : EMA89 : EMA89
emaMedium = isintraday? interval==1? EMA180 : EMA200 : EMA200
emaSlow = isintraday? interval==1? EMA540 : EMA633 : EMA633
plot(emaFast, color=green,linewidth=3,transp=20,title="EMA fast")
plot(emaMedium, color=orange,linewidth=3,transp=20,title="EMA medium")
plot(emaSlow, color=yellow,linewidth=3,transp=20,title="EMA slow")
plot( ShowEMA36_Ribbon?EMA12:na, color=maColor(EMA12,EMA12,EMA36), style=line, title="MA12", linewidth=1,transp=20)
plot( ShowEMA36_Ribbon?EMA15:na, color=maColor(EMA12,EMA15,EMA36), style=line, title="MA15", linewidth=1,transp=20)
plot( ShowEMA36_Ribbon?EMA18:na, color=maColor(EMA12,EMA18,EMA36), style=line, title="MA18", linewidth=1,transp=20)
plot( ShowEMA36_Ribbon?EMA21:na, color=maColor(EMA12,EMA21,EMA36), style=line, title="MA21", linewidth=1,transp=20)
plot( ShowEMA36_Ribbon?EMA24:na, color=maColor(EMA12,EMA24,EMA36), style=line, title="MA24", linewidth=1,transp=20)
plot( ShowEMA36_Ribbon?EMA27:na, color=maColor(EMA12,EMA27,EMA36), style=line, title="MA27", linewidth=1,transp=20)
plot( ShowEMA36_Ribbon?EMA30:na, color=maColor(EMA12,EMA30,EMA36), style=line, title="MA30", linewidth=1,transp=20)
plot( ShowEMA36_Ribbon?EMA33:na, color=maColor(EMA12,EMA33,EMA36), style=line, title="MA33", linewidth=1,transp=20)
plot( EMA36, color=ShowEMA36_Ribbon?maColor(EMA12,EMA36,EMA36):red, style=line, title="MA36", linewidth=1,transp=20)
filteredtopf = filterBW ? isRegularFractal(1) : isBWFractal(1)
filteredbotf = filterBW ? isRegularFractal(-1) : isBWFractal(-1)
topfractals = na
botfractals = na
topfractals := filteredtopf ? high_ : topfractals
botfractals := filteredbotf ? low_ : botfractals
topfcolor = na
botfcolor = na
topfcolor := topfractals != topfractals ? na : green
botfcolor := botfractals != botfractals ? na : red
plot(ShowFractalLevels? topfractals : na, color=topfcolor, transp=0, linewidth=2)
plot(ShowFractalLevels? botfractals : na, color=botfcolor, transp=0, linewidth=2)
higherhigh = filteredtopf == false ? false : ( valuewhen(filteredtopf == true, high_ , 1) < valuewhen(filteredtopf == true, high_ , 0) and
(ShowPivots or valuewhen(filteredtopf == true, high_ , 2) < valuewhen(filteredtopf == true, high_ , 0)))
lowerhigh = filteredtopf == false ? false : ( valuewhen(filteredtopf == true, high_ , 1) > valuewhen(filteredtopf == true, high_ , 0) and
(ShowPivots or valuewhen(filteredtopf == true, high_ , 2) > valuewhen(filteredtopf == true, high_ , 0)))
higherlow = filteredbotf == false ? false : ( valuewhen(filteredbotf == true, low_ , 1) < valuewhen(filteredbotf == true, low_ , 0) and
(ShowPivots or valuewhen(filteredbotf == true, low_ , 2) < valuewhen(filteredbotf == true, low_ , 0)))
lowerlow = filteredbotf == false ? false : ( valuewhen(filteredbotf == true, low_ , 1) > valuewhen(filteredbotf == true, low_ , 0) and
(ShowPivots or valuewhen(filteredbotf == true, low_ , 2) > valuewhen(filteredbotf == true, low_ , 0)))
// If selected show HH/LL on top/below candles.
isup = exitClose>exitOpen and exitClose>pacU and exitClose emaMedium)
isdown = exitClosepacL and (not filterEMA200 or pacC<emaMedium)
up_alert = 0
dn_alert = 0
up_alert := isup ? na(up_alert ) ? 1 : up_alert +1 : 0
dn_alert := isdown ? na(dn_alert ) ? 1 : dn_alert +1 : 0
plotarrow(ShowPACexit and UseBigArrows? up_alert ==1? 1 : dn_alert ==1? -1 : na : na, colorup=aqua, colordown=fuchsia, transp=20,minheight=10,maxheight=60, title="SCALPSWING Alert Arrows")
plotshape(ShowPACexit and not UseBigArrows? up_alert ==1? true : na : na, title='TTSS Buy Arrow', location=location.belowbar, color=green, style=shape.arrowup, text="BUY", textcolor=green,transp=0)
plotshape(ShowPACexit and not UseBigArrows? dn_alert ==1? true : na : na, title='TTSS Sell Arrow', location=location.abovebar, color=red, style=shape.arrowdown, text="SELL",textcolor=red,transp=0)
// generate an alert if required.
alertcondition(up_alert==1, title="TTSS alert Up", message="SWING_UP")
alertcondition(dn_alert==1, title="TTSS alert Down", message="SWING_DN")

Divislab - Elliott wave analysis - 5th wave impulse It is in 3rd of 5th wave and expected minor high before it correcting in 4th subwave. It is expected to move higher again once the correction will over as far as it holds the trend channel.


Short Divislab Short Divislab on completion of Deep Gartley pattern.
Stop and Targets are as mentioned on the charts.

DIVISLAB Following Assending TriangleDIVISLAB Following Assending Triangle can give breakout above 4240-4245 will touch 4280 -4350


FOR SHORT TERM LONG SIDEPHARMA SECTOR STOCKS BEST FOR SHORT TERM OR LONG TERM INVESTMENT POINT OF VIEW AND AS PER MY ANALYSIS DIVISLAP CAN TOUCH MY ENTRY POINT LEVEL .....


buy divislabfresh breakout in divislab..we may see 4500/4750 in coming days. view negated below 3700

divis lab formed double bottom and ready for breakoutDivis lab formed double bottom and ready for breakout if it sustanced above the break out level market
