DIVIS lab near major supportDivislab is oversold and near major support... Price might accumulate further and breaks the downtrend line... Wait for the breakout or keep tight stop loss if you want to enter early
DIVISLAB trade ideas


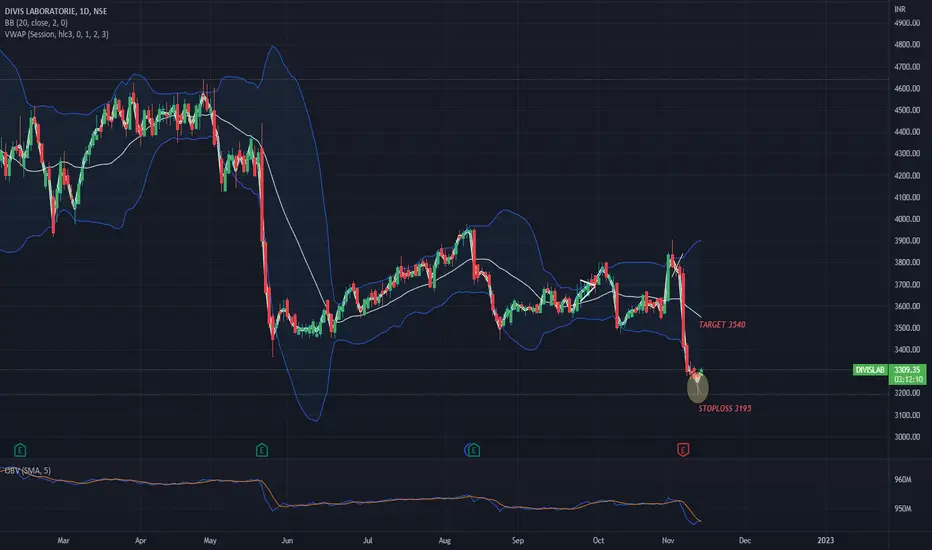
Divislab shortterm swing trade 1-3 daysDivislab showing short term strength. expecting retracement to the Daily downtrend line.

Divis Lab Head & ShoulderDivis Lab
Head & Shoulder Breakdown on Weekly Chart
CMP 3391
downside Target 2500
3 to 6 months

DIVIS LAB - AVOID H&S Pattern coupled with BAD Results and Margin Contraction....Better opportunities available avoid...
2450 2600 levels if possible can be good zone...

Intraday idea for 30/1/23Wait for d stock to close above Trend line on 15 min time frame n make entry when next candle breaks high of previous candle.


divislabDivislab made rounding bottom formation on 30 min TF & breaking above neckline with good volumes.
Could be bought with mentioned stoploss & target.

DIVISLAB Buy Idea 08.01.2023As per my analysis, NSE:DIVISLAB is continue trading above support of 3355. My idea is to take entry at 3427 with stop loss of 3300 (-127 Points Risk). My expected up side target will be 3630 (+203 Points).
Note: This is my personal analysis, only for learning. Thanks.

#DIVISLAB #TORNTPHARM #ALKEM #AUROPHARMA #BIOCON #LUPIN #CIPLA #DIVISLAB
NSE: DIVISLAB
CMP: 3498
TP: 4200
SL: 3300
TF: <6m
RR > ~3.4 times
Return > 20%
THYROCARE CNXPHARMA LUPIN SUNPHARMA SPARC DIVISLAB DRREDDY AUROPHARMA BALPHARMA GLENMARK SANOFI PFIZER BPLPHARMA MARKSANS BIOCON GRANULES IPCALAB LAURUSLABS NATCOPHARM GLAND ALKEM ZYDUSLIFE APOLLOHOSP FORTIS AARTIDRUGS ZYDUSWELL MAXHEALTH BAJAJHCARE
Factors:
BULLISH WEDGE BREAKOUT
Trend Following
Rising Volume with rising Prices.
Flag pattern breakout.
Pennant Pattern Breakout with Bullish Candle.
Retest Successful.
Higher Highs & Higher Lows.
Broken above RESISTANCE levels
Trading at SUPPORT levels
Earnings are strong.
Bullish Wedge Breakout
Risk Return Ratio is healthy.
And
Rising from Double Bottom Pattern to Flag Pattern forming.
If you like my work KINDLY LIKE SHARE & FOLLOW this page for free Stock Recommendations.
With 💚 from Rachit Sethia


divislabDivislab made butterfly pattern on 30 min TF with good volumes.
Could be bought only above 3350, as it confirms pattern
With mentioned stoploss & target.

DIVISLAB GO LONG divislab still sl valid go long given on charts ...pehle bhi diya hai abhi tak valid hai sl break nahi hua


Divis Lab Trend AnalysisA debt free large cap company with strong fundamentals.
Technically bearish as price broke the neckline of Head & Shoulder pattern.
Bullish divergence with RSI indicating reversal can happen but RSI hasn't entered the bearish oversold range of sub 25 levels.
As per Head & Shoulder pattern, the technical target is around 1850 level which lies at golden Fib zone to add confluence.
Good to accumulate around 1800-2000 levels for the following targets:
Medium term swing target @ 4300 (132% ROI)
Long term swing target @ 6750 (264% ROI)
Long term positional target @ 8400 (354% ROI) 3-4 years holding period.
Previous rally gave more than 900% returns in 4 years & 5 months so my targets are realistic.
If you wish to buy above the said levels then better to do SIP monthly rather than investing in one go.
Do your own due diligence before taking any action.
Peace!!

Divis Laboratories potential Breakout ?The idea here is about Divis Laboratories:
Divis Laboratories Ltd is engaged in the manufacture of Active Pharma Ingredients (APIs) and intermediates. The company in a matter of short time expanded their breadth of operations to provide complete turnkey solutions to the domestic Indian pharmaceutical industry.They are actively involved in developing alternate, patent non-infringing processes for APIs, for the inventors to manage late life cycle and leading generic drug manufacturers.
My view is neutral at the moment for the below observed technical factors.
Points as per TA on a Weekly Chart:
1. Current market condition isn’t been good due to high volatility back in action any trade entries should be done very carefully and cautiously.
2. BSE 100 ( Divis lab included in) has lost 272.58 points on 11th Oct 2022. However, daily candle indicates it can still bounce back as Anti butterfly harmonic pattern observed as per below:
3. Currently under downtrend channel on a weekly chart as per below:
4. Contracting triangle formation inside downtrend channel as per below:
5. Bearish Bat harmonic pattern CD leg in progress at the time of publishing as per below:
6. Trading way above 200 EMA & below 20 EMA on a weekly chart.
7. Ichimoku Cloud analysis: Kumo Breakout strong downtrend & Kumo Twist weak trend on weekly,monthly chart is Strong for an upward momentum for Kumo breakout & kumo twist on daily both are strong downtrend at the time of publishing .
8. RSI is at 37.55 on a weekly Chart and 35.05 on daily chart at the time of publishing.
9. MACD above signal line on weekly & below on daily chart.
10. Hull Moving average and other moving averages on a daily,weekly chart is strong sell & monthly chart is a sell.
11. ADX (Average directional index ) trend strength is at 28.42 on a weekly(ADX between 25-50 is a strong trend) and 14.13 on a daily chart which indicates a absent or weak trend (ADX between 0-25 is a Absent or weak trend).
Long Entry : if the price breaks above contracting triangle & breaks downtrend.
Short Entry : If price breaks below the contracting triangle and support zone.
Projected Target: provided in the chart as per bearish bat Crab harmonic pattern.
Stop Loss: Enter only if it breaks downtrend & contracting triangle.
Disclaimer: “The above is an Educational idea only and not any kind of financial or investment advice. So please do your own DD (Due Diligence) before any kind of investment”.
Do you like my TA & ideas!!
Want to keep yourself updated with current market action? Then don’t forget boost & to subscribe for more analysis.
Do leave your valuable feedback & comments for any improvisations.
Cheers.

DIVISLABDIVISLAB..
As I saw weakness in NIFTY PHARMA INDEX... I found weakness in some pharma stocks also... like DIVISLAB
.
On my radar for further price decrease

Divi's Laboratories Long Term Technical Analysis :
-- Strict Stop Loss = 3150
-- Risk : Reward = 1 : 3
-- Target - 1 = 4059
-- Target - 2 = 4597
-- Target - 3 = 4988
-- Strong support at 3039.
-- Re enter the trade at 3185
-- Touching 200 EMA
Fundamental Analysis :
-- Divi's Lab has a healthy ROE.
-- Over the last 5 years, revenue has grown at a yearly rate of 17%
-- ROCE: Maintaining healthy ROCE of 31.64% (1 year), 28.31(3 years), and 26.9% over the past 5 years.
-- Healthy dividend payout
-- Debt-to-Equity: Divi''s Lab has a Debt to Equity ratio of 0.00
-- CAGR: 10 years - 19%
-- Cash Flow: Positive cash flow over the last 5 years
-- P/E ratio: 10 years PE is close to the average PE. So Stock is not overvalued

divislabDivislab made classic HAMMER pattern on daily charts & trading strong with good volumes. As long as it stays above yesterday's low consider it as reversal.
Could be bought with mentioned stoploss & target.
Aggressive traders can add more above 3325 as it confirms 3 candle reversal pattern.
Interesting days ahead for Divis, will it break bearish trend?It's an interesting set up for Divis labs where it took support ~3220-3240 and going towards immediate resistance 3440.
However, bearish trend to have an upper hand given last 9 months movement.
Fingers crossed and next 4-6weeks is key for scrip. Short term positions will be with below support csnd resistance points.
Down -- 3000, 2800, 2400
Up ---3440, 3500,3750,3950

Divis lab bullish reversal on hour daily and weekly timeframeDivis lab moving in a tight box for last two weeks and break upside on friday. On weekly tf, it took support from 200ema followed by doji and this week closing above doji, clearly indicating an upmove in coming weeks. On daily and hourly tf, BO from box after 2week consoy. Also parent index, niftypharma, close above 50 and 200ema, which support the move will continue upside.

DIVISLAB READY FOR BREAKOUTDIVISLAB is ready to breakout from triangle pattern. expected a rally after retest. Do your analysis and comment

DIVIS LABDivis lab 1 day chart 3960 could be react as resistance zone and it is already down by 30% from its all time high
