Dixon swing tradeHello,
Trend-Based Analysis. Buy the Dips, Sell The Rallies, Also Following the Trend. Let's see where the Price Action takes us, Riding the wave. Potential trade setups based on trend momentum.
Technical analysis based on trend identification and momentum, Looking for high-probability setups within the prevailing trend.
Analyzing the current market trend and potential future price movement. Focusing on risk management and reward-to-risk ratios.
Details is Mentioned in Chart, Read carefully.. .
DIXON trade ideas
Dixon : Fibonacci Daily Timeframe AnalysisDixon is following Fibonacci levels perfectly for long and short durations.
1. Long duration Trend based Fibonacci extension: Started Sept 2019 and ended at Jan 23
2. Short duration / recent Trend based Fibonacci extension: Started June 2024 and ends at July 2024
Strock behaviour:
- Stock is following trend lines and Fibonacci trend-based extension levels.
- Currently at 1.618 level of short duration Trend based Fibonacci extension, which will act as a resistance at 17,763
- Also at 2.618 level of long duration Trend based Fibonacci extension, which will act as a resistance at 17,650
- In addition top trend line should act as a resistance
Expectation:
- Stock should take resistance at these levels and should retrace to retest 20 EMA on daily timeframe.
- Need more than average volume to break these levels
- Lower levels to keep an eye L1- 16,600 and L2 16,000
- Once break out resistance level of 17,700 with volume will test T arget L1 - 22,300 and Target L2 23,400

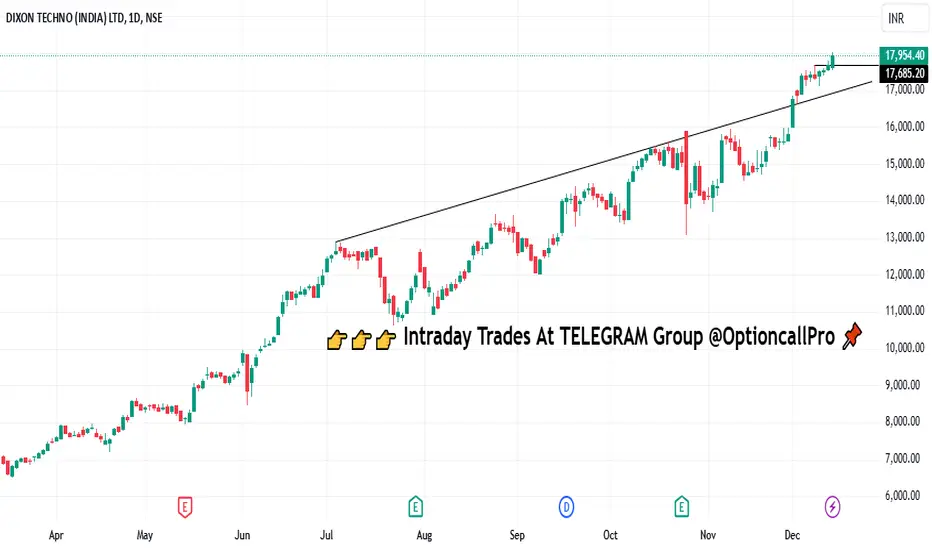
Dixon.Dixon, wait for falling back to channel. wait for going up or falling back to channel.
lets see.
education purpose only.

Dixon Technologies - Short term & for risk takersDixon is on dream run since 2 years.. multi bagger and huge value creator for both investors and traders
suggest to accumulate in dips up to 12000 levels and wait for the following targets
Target -1 = 13,630 (6% up side from CMP)
Target -2 = 14,618 (13.7% upside from CMP)
Target -3 = 16.230 (26.5% upside from CMP)
Stoploss = 10,945 (15% downside from CMP)
Mobile manufacturing and Electronics manufacturing is booming in india and expected to do well until 2026.
this idea is only for education purpose and cannot be taken for real time investment or trading. please consult your financial adviser before taking any decision
I am personally holding this stock in my portfolio.

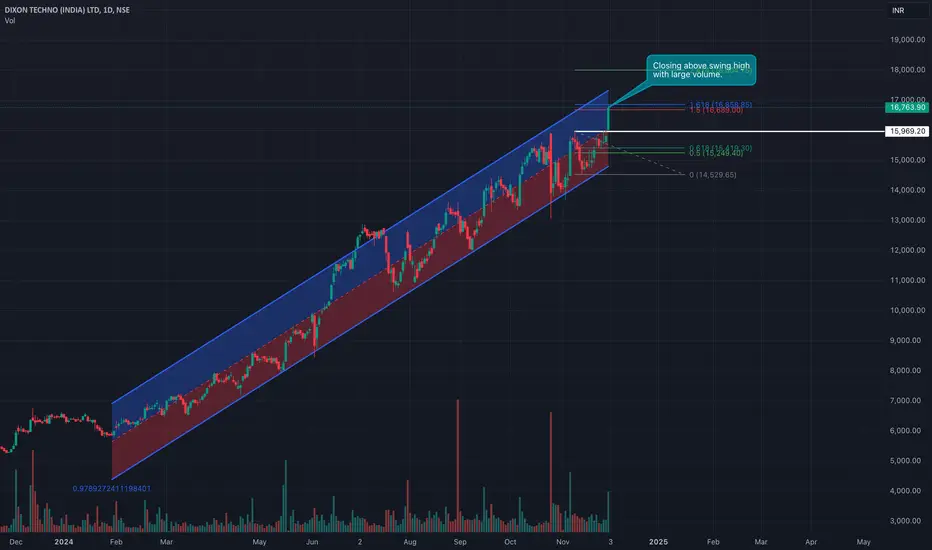
Dixon Tech: Turning bullish in short term swingToday it closed above previous swing high with good volume.
Stock is already in bullish trend since long time. It is in bullish channel.
You can buy at current price around 16800 or lower.
For SL if you turn to 1H timeframe, 16500 close is your SL.
Good for swing trade for short number of days.
Targets not decided as price is ATH but with help of fibonacci 18000 looks like a good target.
Trade looks good with risk reward also.
Red Alert in DixonPls check the structure of the market in regard to Dixon Tech.
I feel its going to break badly.
No buy/sell recommendation its just an opinion.
Regards

Dixon Tech Analysis - Bullish Ascension
🚀 Dixon Tech shows a powerful breakout, with the price spiking +8.7% today, taking it to INR 15,655! This move keeps the stock within its ascending channel, with clear signs of continued bullish strength. 📊
Key Levels to Watch:
Resistance Zone: INR 16,000 - 16,300 is the potential upside, where Dixon may face some selling pressure if it reaches this area.
Support Zone: A critical support level is identified around INR 15,360. A break below this level could invalidate the short-term bullish outlook, shifting the trend towards a possible downside move.
💡 Price Action: Dixon’s price remains supported within the channel, and a strong volume spike suggests renewed buying interest. The next potential move could push towards the upper boundary near INR 16,000+ levels, following the recent breakout above resistance.
📊 Trading Strategy: For bulls, any dip towards the lower trendline or the support zone could present a buying opportunity, while aggressive traders might consider profit-booking around the 16,000 - 16,300 range.

DIXONHi guys i am back now after long holiday lets make money if someone loose there is some changes in dixons level now please pay attention,if i am right previous levels are still working well,after this post iwill go for BITCOIN then OFSS.
Dixon almost kissed it's previous high so wait for support to get long.

DIXON again looking bullish?DIXON fell almost 13% but recovered back above SMA50 and 38.2fib back inside the rising channel. Almost 900 points off the bottom. Should look for further upside after posting brilliant earnings report.
Dixon Technologies is currently trading within a well-defined upward channel on the 4-hour chart, suggesting a bullish trend. The stock has touched key resistance levels in the range of ₹14,370 to ₹15,490, which could act as a potential upside target. However, there’s a notable cautionary signal—an invalidation level marked below ₹12,950. If Dixon closes below this level, it could signify a breakdown from the channel, indicating a possible bearish reversal.
Supporting the bullish sentiment, Dixon recently announced impressive earnings on October 24. The company outperformed market expectations, reporting revenue of ₹115.34 billion, which is 27.56% higher than the anticipated ₹90.42 billion. Additionally, the earnings per share came in at ₹34, beating estimates of ₹32.33 by 5.16%. This strong financial performance indicates robust business growth and highlights Dixon’s ability to capitalize on demand.
Overall, while technical indicators suggest the stock is poised for potential gains, investors should remain vigilant of the invalidation level as a risk threshold. If Dixon maintains its upward trend, supported by solid financials, it could continue to attract buyers, but caution is advised near the lower channel boundary.

DIXON Short Setup: Evening Star & Potential HNS with Trendline Weekly Analysis
Pattern Observed: Evening Star on Weekly Timeframe
Additional Insights
- The Evening Star pattern tends to be more reliable on Daily and Weekly timeframes, making this setup particularly noteworthy for swing traders.
Trade Setup
1. Entry: Enter after a decisive break below the low of the third (red) candle in the Evening Star pattern.
- Alternatively, you may enter on the fourth candle if it signals a reversal, with a stop loss set according to your risk tolerance.
2. Stop Loss (SL): Can be set based on your risk preference, usually just above the high of the Evening Star pattern.
3. Target (TGT): Consider scaling out at key support levels or use the measured HNS target as detailed below if the formation completes.
---
Potential Head and Shoulders (HNS) Formation
Trade Setup for HNS Pattern:
1. Entry : Enter when price decisively breaks below the neckline on a closing basis.
2. Target (TGT): Measure the distance from the top of the head to the neckline and project it downwards from the neckline for your target.
3. Stop Loss (SL): Place the stop above the head of the HNS pattern.
---
Additional Confirmation
I've drawn a trendline to monitor for a potential breakdown. If either the Evening Star or HNS pattern aligns with a trendline break, it would serve as an additional confirmation for a short position.
---
This setup combines a confluence of technical factors, making it robust for weekly trading decisions. Comments and thoughts welcome!
IMPORTANT THINGS TO REMEMBER
1. Don't be fooled by opearators Theyll try it take it up to sell
2. Don't be a hero, follow SL with 1% extra loss max. (as setup is on Weekly TF)


DIXON TECHNO S/RSupport and Resistance Levels:
Support Levels: These are price points (green line/shade) where a downward trend may be halted due to a concentration of buying interest. Imagine them as a safety net where buyers step in, preventing further decline.
Resistance Levels: Conversely, resistance levels (red line/shade) are where upward trends might stall due to increased selling interest. They act like a ceiling where sellers come in to push prices down.
Breakouts:
Bullish Breakout: When the price moves above resistance, it often indicates strong buying interest and the potential for a continued uptrend. Traders may view this as a signal to buy or hold.
Bearish Breakout: When the price falls below support, it can signal strong selling interest and the potential for a continued downtrend. Traders might see this as a cue to sell or avoid buying.
20 EMA (Exponential Moving Average):
Above 20 EMA(50 EMA): If the stock price is above the 20 EMA, it suggests a potential uptrend or bullish momentum.
Below 20 EMA: If the stock price is below the 20 EMA, it indicates a potential downtrend or bearish momentum.
Trendline: A trendline is a straight line drawn on a chart to represent the general direction of a data point set.
Uptrend Line: Drawn by connecting the lows in an upward trend. Indicates that the price is moving higher over time. Acts as a support level, where prices tend to bounce upward.
Downtrend Line: Drawn by connecting the highs in a downward trend. Indicates that the price is moving lower over time. It acts as a resistance level, where prices tend to drop.
RSI: RSI readings greater than the 70 level are overbought territory, and RSI readings lower than the 30 level are considered oversold territory.
Combining RSI with Support and Resistance:
Support Level: This is a price level where a stock tends to find buying interest, preventing it from falling further. If RSI is showing an oversold condition (below 30) and the price is near or at a strong support level, it could be a good buy signal.
Resistance Level: This is a price level where a stock tends to find selling interest, preventing it from rising further. If RSI is showing an overbought condition (above 70) and the price is near or at a strong resistance level, it could be a signal to sell or short the asset.
Disclaimer:
I am not a SEBI registered. The information provided here is for learning purposes only and should not be interpreted as financial advice. Consider the broader market context and consult with a qualified financial advisor before making investment decisions.

Dixon Technologies to go for further upside?🚀 Dixon Technologies on the Verge of a Breakout! 🚀
Looking at the 4-hour timeframe, we see an interesting setup forming. Dixon Tech has shown resilience by bouncing off a well-established channel that’s trending upward. It’s touched the upper trendline multiple times, giving us a potential double top scenario. 📈
However, the latest breakout from the downtrend suggests momentum could be brewing! 🧐 Will we see another double top formation, or will this rally break through? Key levels to watch: Potential upside targets are in the range of 14,830 to 15,550, with resistance zones marked out.
If you're waiting for an entry, an ideal dip toward 14,200 could be the sweet spot. Bulls need to keep an eye on 13,870, as breaking below this would invalidate the bullish setup.
The market's moving fast—are you ready to ride the next wave? 🌊💥 Let’s see how this plays out!

Dixon's Bearish Breakdown – All Targets Smashed!DIXON Stock Technical Analysis:
In the 15-minute timeframe, Dixon saw a short trade entry at ₹15,199.60, with prices moving decisively lower, hitting all the predefined targets.
Key Levels:
Entry: ₹15,199.60
Stop Loss (SL): ₹15,349.80
Target 1 (TP1): ₹15,013.95
Target 2 (TP2): ₹14,713.50
Target 3 (TP3): ₹14,413.10
Target 4 (TP4): ₹14,227.45
Observations:
The price plunged after a clear rejection below the Risological dotted trendline, confirming the downtrend.
Dixon met all short targets as it continued its bearish trajectory.
This short trade capitalized on a strong breakdown, with all targets being successfully hit. Traders should remain cautious as the bearish momentum might be slowing down, offering potential reversal signals ahead.

DIXON I am very sad to see that my all supports breached today after showing good result its just profit booking and panic but ones should not long for 2 days.chance will be better to invest.

DIXONAs per my view if dixon would not break its previous high there is a chance to test 14496 as shown in this chart,before making decision we should remember other supports are there as well.

DIXON TECHWhat is happening here can be seen and understsnd easily.after break out it will be more bullish.

Dixon Daily Trade: 350% Massive Growth SecuredWe entered a long position on Dixon at 3253.30, and the trade has seen a remarkable growth of 358.54% over 511 days. With all targets up to TP4 (5619.40) successfully achieved, the trailing stop is currently at 11,790 to protect and safeguard our profits. This trailing stop will ensure that gains are locked in if the price pulls back to this level.
Target Points Achieved:
TP 1: 3686.05
TP 2: 4386.35
TP 3: 5086.65
TP 4: 5619.40
Trailing Stop: 11,790
Stop Loss (SL): 2903.15
We’ll continue to hold the position as the price trends upward, while the trailing stop secures our profits.
This massive positional trade demonstrates the strength of the Risological swing trading indicator.
Another killer trade caught!

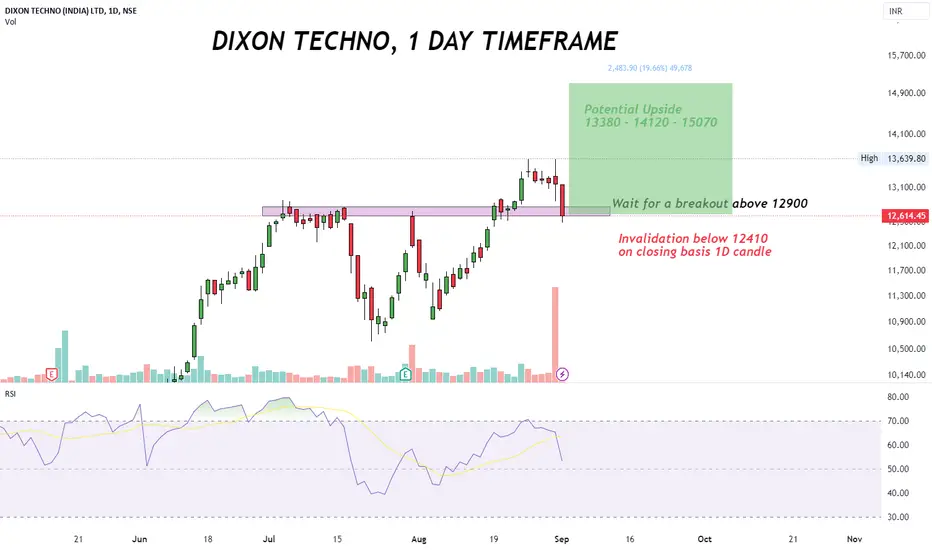
Dixon Tech., Fake-Breakout in Daily with Bearish DivergencesDixon Technologies, Fake-Breakout with Bearish Divergence in Daily Timeframe, Shows a possible reversal of a Bullish Trend into Bearish Trend with following possible targets
CMP - 12614
T1 - 12000
T2 - 10800
Stop Loss - 12885

DIXON LONG 11100Dixon Broken Weekly Supply 12900
Dixon Broken Demand 12545
Next Level Dixon Daily Demand 11100
Dixon weekly Demand 11475
Dixon SL 10650 -Daily Closing Basis
Dixon Long at 11475 & 11100

DIXON TECHNO (INDIA) LTDSupport and Resistance Levels:
Support Levels: These are price points (green line/shade) where a downward trend may be halted due to a concentration of buying interest. Imagine them as a safety net where buyers step in, preventing further decline.
Resistance Levels: Conversely, resistance levels (red line/shade) are where upward trends might stall due to increased selling interest. They act like a ceiling where sellers come in to push prices down.
Breakouts:
Bullish Breakout: When the price moves above resistance, it often indicates strong buying interest and the potential for a continued uptrend. Traders may view this as a signal to buy or hold.
Bearish Breakout: When the price falls below support, it can signal strong selling interest and the potential for a continued downtrend. Traders might see this as a cue to sell or avoid buying.
20 EMA (Exponential Moving Average):
Above 20 EMA: If the stock price is above the 20 EMA, it suggests a potential uptrend or bullish momentum.
Below 20 EMA: If the stock price is below the 20 EMA, it indicates a potential downtrend or bearish momentum.
Trendline: A trendline is a straight line drawn on a chart to represent the general direction of a data point set.
Uptrend Line: Drawn by connecting the lows in an upward trend. Indicates that the price is moving higher over time. Acts as a support level, where prices tend to bounce upward.
Downtrend Line: Drawn by connecting the highs in a downward trend. Indicates that the price is moving lower over time. It acts as a resistance level, where prices tend to drop.
RSI: RSI readings greater than the 70 level are overbought territory, and RSI readings lower than the 30 level are considered oversold territory.
Combining RSI with Support and Resistance:
Support Level: This is a price level where a stock tends to find buying interest, preventing it from falling further. If RSI is showing an oversold condition (below 30) and the price is near or at a strong support level, it could be a good buy signal.
Resistance Level: This is a price level where a stock tends to find selling interest, preventing it from rising further. If RSI is showing an overbought condition (above 70) and the price is near or at a strong resistance level, it could be a signal to sell or short the asset.
Disclaimer:
I am not a SEBI registered. The information provided here is for learning purposes only and should not be interpreted as financial advice. Consider the broader market context and consult with a qualified financial advisor before making investment decisions.

LONG WORTHY RETEST FOR DIXON TECH?this is going to be once in a lifetime retest for a massive stock swing.
Dixon Tech LongWeekly BUFL 12700
Daily Demand 12788
Price already created DMIP
suggest to Long at retest level 12700
SL is300 Points
Target 15200
RR 1: 10
