DRREDDY trade ideas

Drreddy looking good. For Round 2 of rally !!After a steep correction from highs of 5k plus, looks to form support near 4.3k which happens to the be the trendline support as well.
Can enter in cash or deploy hedge trade for safe return. !!

Possible bounce is due..RSI divergence + tested previous consolidation zone + higher volumes than previous few day(s) with green candle.
Breaking of upper trend line may give some long trading opportunity.
Just my study. Not any trading or investing advice.

Supply Zone Broken and Retest doneDR Reddy as long as closing above the supply zone, expect downside target marked on the chart for long term.
Lets' see..


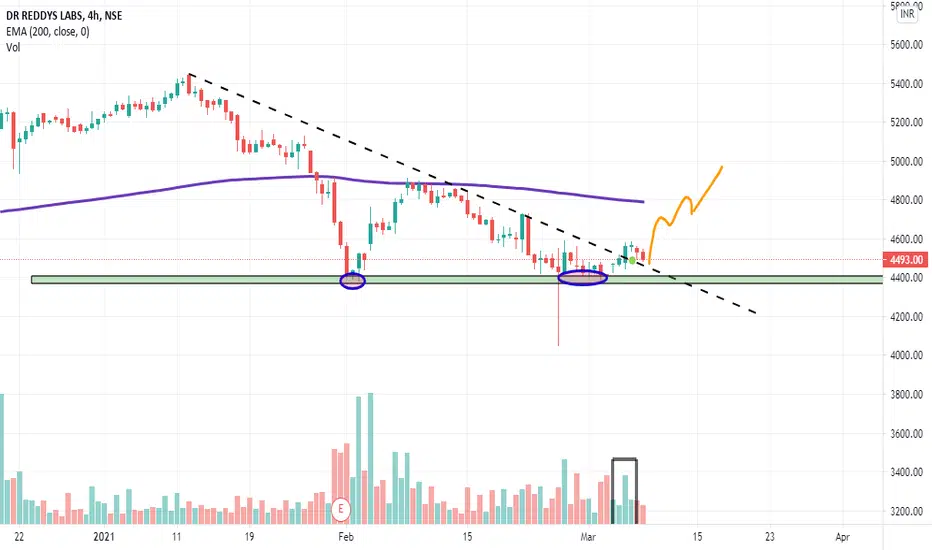
DRREDDY up moveCurrently DRREDDY is trading below 200 EMA on 4 hrs time frame. However it has taken support which is marked on the chart.
It has also broken the trendline with reasonable volumes marked on chart. Seems like ready for a up move in coming weeks.
This is just for an educational purpose.

DRREDDY - Breakout ?DR REDDYS LABS
Bouncing on support
Bouncing off Weakly 50 MA
Look for buy on trendline breakout
targets in green

DR REDDYS LABS Analysis 02/03/2021may retrace more if the fib support area breaks but we can be optimistic about the rally too and if rallied without retracement, we can be sure about the achievement of the 2 TP
but if retraced and rallied then ATH and 1TP can be the targets consequently


Upside Potential DRREDDYTrend reversal spotted in DRREDDY. Upside move expected.
One can buy when the high breaks and place SL 1ATR below the previous low


dr reddymay be it will took support on the trend line & it will bounce back
RR is favourable..make it in your watchlist


Drreddy - Elliott wave analysis - ABC correction It was doing what exactly expected in earlier updates. The B wave is in progress and may go upside before it starts running down for C wave of corrective cycle.


DRREDDY WEEKLY BEARISH Deep Crab @1.902XA
price need to follow Green Trend line & hit target
If price Breaks Red Trend line is where EXIT before SL hits
POTENTIAL SELL


Drreddy - Elliott wave analysis - Double top formation It ended with truncated ED structure resulting in sharp fall as wave A, which is about to finish soon. Wait for bounce of B wave to short sell for C wave down. It form the double top pattern, but need to confirm the neckline break after correction. The target zone will be 3850.

DRREDDY MONTHLY BEARISH Crab@1.902XA
price need to follow Green Trend line & hit target
If price Breaks Red Trend line is where EXIT before SL hits
POTENTIAL SELL

