Technical Analysis (Weekly Chart)Technical Analysis (Weekly Chart)
📊 Setup Details:
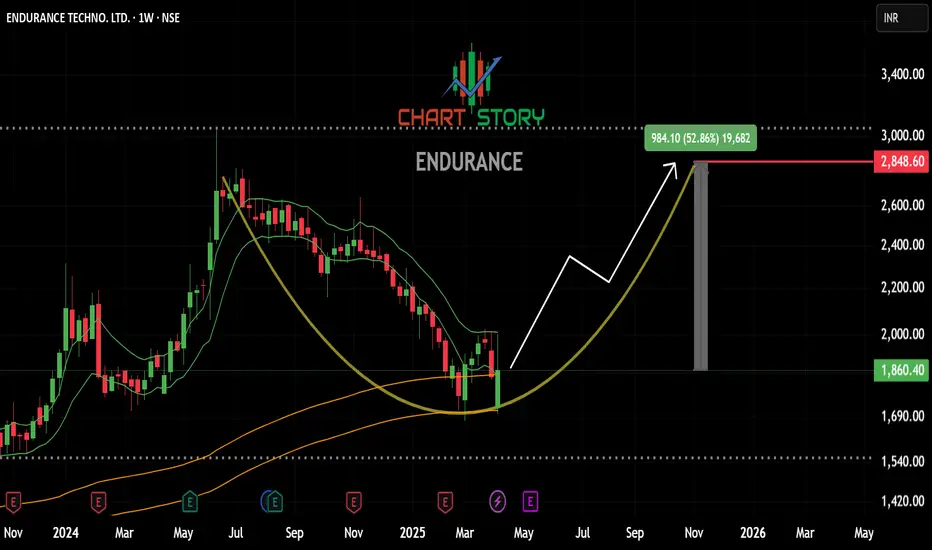
CMP: ₹2,796.60
Price has broken out above the ₹2,348 resistance and retested it successfully this week with a strong breakout (+7.4%) 🔥.
EMA Stack (5‑9‑20) trending up, reinforcing bullish momentum.
Volume increased significantly on the breakout — a positive signal.
💹 Key Levels & Trade Plan
Level Details
Support ₹2,348 (breakout retest)
Stop Loss Weekly close below ₹2,348
Target 1 ₹3,200 (near ATH)
Target 2 ₹3,600+ (if momentum continues)
🏢 Fundamental Overview (via Screener.in)
FY25 Revenue / Profit: ₹11,561 Cr / ₹836 Cr
Valuation Metrics: P/E ~47.6, P/B ~6.9, Dividend Yield ~0.3%
Profitability: ROCE ~18.2%, ROE ~15.5%
Debt Position: Virtually debt‑free with interest coverage high and Altman Z‑score strong
Growth Profile: 3‑yr sales CAGR ~15%, profit CAGR ~21%, TTM revenue growth ~29%
Pros:
Leading global auto‑ancillary focused on alloy wheels, suspensions, brake systems
markets.ft.com
Robust profitability with low debt and strong cash flows
Secular demand from 2W/3W OEMs (including European expansion)
Cons:
Valuation considered rich (~27–42% premium to intrinsic value)
ROE moderate (~15%), in line with peers
ENDURANCE trade ideas

Endurance - Ready to RollAfter long time consolidation, this auto component maker is about to take a ride.

Ye chart kuch kehta hai - Endurance Tech Endurance Technologies presents a compelling investment case due to:
Consistent revenue and profit growth with improving margins and strong cash flow.
Strategic expansion in Europe and into EV-related products, positioning it well for future automotive trends.
Healthy return ratios and dividend payouts.
Reasonable valuation considering growth prospects and recent stock price correction.
Positive analyst sentiment and earnings beats.
These factors combined provide a strong rationale to consider buying Endurance Technologies stock at its current price, especially for investors seeking exposure to the growing auto components sector with a focus on innovation and geographic diversification.
Strong Financial Performance and Growth Prospects
Endurance Technologies has demonstrated robust revenue growth, with FY 2025 revenue at ₹11,561 crore, up 14% year-over-year, and net income rising 23% to ₹836 crore. The profit margin improved to 7.2% from 6.6% in FY 2024, reflecting operational efficiency.
Earnings per share (EPS) have shown a strong upward trend, reaching ₹59.46 in FY 2025, up from ₹48.38 in FY 2024, beating analyst expectations by 3.7% recently, indicating solid earnings momentum.
The company’s operating profit margin (OPM) has been stable around 13%, with a return on capital employed (ROCE) of 18.2% and return on equity (ROE) at 15.5%, which are healthy indicators of profitability and capital efficiency.
Endurance has maintained a consistent dividend payout (~18%), providing income to shareholders alongside growth potential.

ENDURANCE – Breakout from Supply Zone | Target ₹2136 ⚙️ ENDURANCE TECH LTD (NSE:ENDURANCE)
Time Frame: 15min / 1 Hour
📊 Trade Type: Positional / Intraday Momentum
📌 Buy Zone: ₹2042 (Above supply zone breakout)
🎯 Target 1: ₹2136
🎯 Target 2: ₹2287
🛑 Stop Loss: ₹1915
📈 CMP: ₹2022.60
📌 Chart Insights:
✅ Strong volume breakout from horizontal resistance
✅ Cleared EMA 9/13/26 crossover
✅ RSI > 60 indicates bullish momentum
✅ Bollinger Band breakout (BB %B > 1.00)
✅ Breaking above pivot R2 zone (₹2042) opens room to R3
⚠️ Strategy:
Enter on confirmation above ₹2042 with volume support on 15min or 1H timeframe.
Stop loss below breakout candle or EMA cluster around ₹1915.
Trailing stop as it approaches targets.
For Education Purposes Only

ENDURANCE - LONGNSE:ENDURANCE Weekly double bottom exactly at buying location. Buyers and macd both are active at location .

Positional Trade Idea for #EnduranceTechEndurance Technologies has broken out of a descending triangle pattern, showing bullish momentum with strong volume. This breakout signals a potential upward trend for the stock.
💥 Entry: Around ₹2,510
💥 Target: ₹2,700
💥 Stop-Loss: ₹2,350
#StockMarket #Trading #PositionalTrade #Breakout

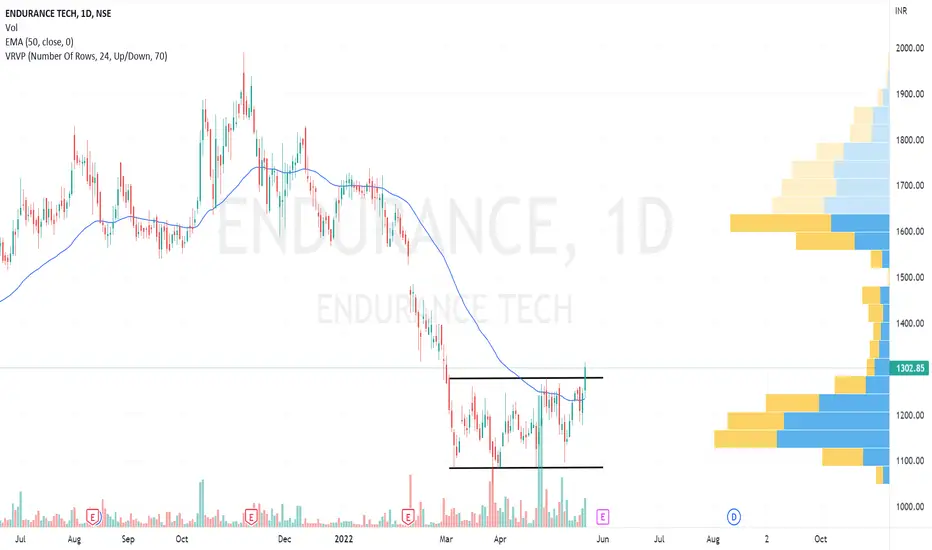
ENDURANCE TECH S/R Support and Resistance Levels:
Support Levels: These are price points (green line/shade) where a downward trend may be halted due to a concentration of buying interest. Imagine them as a safety net where buyers step in, preventing further decline.
Resistance Levels: Conversely, resistance levels (red line/shade) are where upward trends might stall due to increased selling interest. They act like a ceiling where sellers come in to push prices down.
Breakouts:
Bullish Breakout: When the price moves above resistance, it often indicates strong buying interest and the potential for a continued uptrend. Traders may view this as a signal to buy or hold.
Bearish Breakout: When the price falls below support, it can signal strong selling interest and the potential for a continued downtrend. Traders might see this as a cue to sell or avoid buying.
20 EMA (Exponential Moving Average):
Above 20 EMA(50 EMA): If the stock price is above the 20 EMA, it suggests a potential uptrend or bullish momentum.
Below 20 EMA: If the stock price is below the 20 EMA, it indicates a potential downtrend or bearish momentum.
Trendline: A trendline is a straight line drawn on a chart to represent the general direction of a data point set.
Uptrend Line: Drawn by connecting the lows in an upward trend. Indicates that the price is moving higher over time. Acts as a support level, where prices tend to bounce upward.
Downtrend Line: Drawn by connecting the highs in a downward trend. Indicates that the price is moving lower over time. It acts as a resistance level, where prices tend to drop.
RSI: RSI readings greater than the 70 level are overbought territory, and RSI readings lower than the 30 level are considered oversold territory.
Combining RSI with Support and Resistance:
Support Level: This is a price level where a stock tends to find buying interest, preventing it from falling further. If RSI is showing an oversold condition (below 30) and the price is near or at a strong support level, it could be a good buy signal.
Resistance Level: This is a price level where a stock tends to find selling interest, preventing it from rising further. If RSI is showing an overbought condition (above 70) and the price is near or at a strong resistance level, it could be a signal to sell or short the asset.
Disclaimer:
I am not a SEBI registered. The information provided here is for learning purposes only and should not be interpreted as financial advice. Consider the broader market context and consult with a qualified financial advisor before making investment decisions.

SWING IDEA - ENDURANCE TECHNOEndurance Technologies , a prominent player in the auto components industry, is exhibiting technical signals that indicate a potential swing trade setup.
Reasons are listed below :
Break of Flag and Pole Pattern : The stock has broken out of a bullish flag and pole pattern, which is typically a continuation pattern signaling further upward momentum.
50 EMA Support on Daily Timeframe : The stock is holding support above the 50-day exponential moving average (EMA), suggesting that the trend is intact and providing a strong base for potential gains.
Bullish Marubozu on Daily Timeframe : The formation of a bullish marubozu candle on the daily chart indicates strong buying pressure, further confirming the upward movement.
Volume Spike : A noticeable increase in trading volumes signals heightened investor interest and adds credibility to the breakout.
Target - 2820 // 3060
Stoploss - daily close below 2400
DISCLAIMER -
Decisions to buy, sell, hold or trade in securities, commodities and other investments involve risk and are best made based on the advice of qualified financial professionals. Any trading in securities or other investments involves a risk of substantial losses. The practice of "Day Trading" involves particularly high risks and can cause you to lose substantial sums of money. Before undertaking any trading program, you should consult a qualified financial professional. Please consider carefully whether such trading is suitable for you in light of your financial condition and ability to bear financial risks. Under no circumstances shall we be liable for any loss or damage you or anyone else incurs as a result of any trading or investment activity that you or anyone else engages in based on any information or material you receive through TradingView or our services.
@visionary.growth.insights

Endurance Tech LongEndurance Tech
MTF Analysis
Endurance TechYearly Demand up
Endurance Tech 6 Month Demand BUFL 1948
Endurance TechQtrly Demand BUFL 2318
Endurance TechMonthly Demand 2315
Endurance TechWeekly Demand 2315
Endurance TechDaily Demand DMIP 2234
Endurance Tech 240 Demand DMIP 2245
ENTRY -1 2234
SL 2066
RISK 168
Potential Target 3558
First Target Points 2812
First recovery Target Points 746
Last Swing Low 2066
Last Swing High 2812
RR 4
RR 59%

Narrowing price range.Selling gets absorbed and a pull back is due.Will keep for long term and average on downside.

Endurance Tech💥Endurance Technology💥-Nice Breakout
Capital to be deployed-20k
Investing Price-2356-60
Breakout Price-2356
Stoploss-2074
Targets-3194
#endurance #stockstowatch #StocksToBuy #StocksInFocus #stocks #StockMarket

Endurance seems to have endured downside now looking good. Endurance Technologies Limited engages in the manufacture of two-wheeler and three-wheeler automotive components. It offers Aluminium die castings, suspension, transmission and brake systems products. The company was founded by Anurag Jain in November 1985 and is headquartered in Aurangabad, India. CMP of Endurance Technologies is 1878.50.
The positive aspects of the company are Company with Low Debt, Strong cash generating ability from core business - Improving Cash Flow from operation for last 2 years, Company with Zero Promoter Pledge, FII / FPI or Institutions increasing their shareholding. The Negative aspects of the company are High PE (P.E.= 43.5), Increasing Trend in Non-Core Income, Companies with high market cap, lower public shareholding, MFs decreased their shareholding last quarter.
Entry can be taken after closing above 1887. Targets in the stock will be 1945 and 2009. The long-term target in the stock will be 2069 and 2111+. Stop loss in the stock should be maintained at Closing below 1783 or 1727 depending on your risk taking ability.
The above information is provided for educational purpose, analysis and paper trading only. Please don't treat this as a buy or sell recommendation for the stock. We do not guarantee any success in highly volatile market or otherwise. Stock market investment is subject to market risks which include global and regional risks. We will not be responsible for any Profit or loss that may occur due to any financial decision taken based on any data provided in this message.

Endurance Tech. Rally starts after breakoutAuto sector is giving a long rally and endurance is among these. Stock has given a breakout in previous month and now started going up again. currently is is at all time high's. What's your view on it. I am currently studying

endurance#More than 2 years consolidation breakout at ATH level.
#Huge Volume.
#Near 2000 to 2050 is good buying level.
#Investment_Stock
#Negligible non institutional stake.

ENDURANCE NSE:ENDURANCE
Rsi >52
Reverse from Support level
Can add 1650
Swing Trade
1780 is average target in a year
Keep your profit as per your emotion.
This is only for educational purpose.

endurance 1d buy cmp target 1599, 1649, 1727endurance 1d buy cmp target 1599, 1649, 1727
risk reward 2.75
sl 1450

Endurance breakout viewEndurance expecting breakout
Resistance breakout
Follow strict risk reward and stop loss

Endurance BreakoutThe stock has broken out and retested, therefore may undergo a reversal rally. Trade is supported by Supports Nearby.
Risk Reward Ratio - 2:1
SL is placed below the support zone & the lower trendline. The target is placed near resistance.

ENDURANCE TECH - Wykoff theory applied here ENDURANCE TECH - Good distribution & breakout here.
One can go long with a SL of 50 ema.
Potential reversal for EnduranceThe green candle has opened below the close of the previous red candle and closed above the 50% of the previous red candle. The location seems to be a consolidation at the bottom bof a downtrend. If price breaks trendline convincingly with volume, it could mark the beginning of an uptrend. Stoploss and targets are left to the individuals to decide according to their own risk appetite.

endurance technologiesLtd. to manufacture Aluminium Die Casting products at Aurangabad, Maharashtra (India). The Endurance Group is a global force in Aluminium Casting (including Alloy Wheels), Suspension, Transmission and Braking products with annual sale revenue of 551 Million (INR 2,978 Crores) from domestic operations and approx.

endurance technologiesPvt. Ltd. to manufacture Aluminium Die Casting products at Aurangabad, Maharashtra (India). The Endurance Group is a global force in Aluminium Casting (including Alloy Wheels), Suspension, Transmission and Braking products with annual sale revenue of 551 Million (INR 2,978 Crores) from domestic operations and approx.
