Break out done ready for swing..?Break out given with good volume. Can give upside move towards 450-475-500 in 3-4 months
EVEREADY trade ideas

50 SMA Rising - Positional TradeDisclaimer: I am not a Sebi registered adviser.
This Idea is publish purely for educational purpose only before investing in any stocks please take advise from your financial adviser.
It 50 SMA Rising. Suitable for Positional Trading Initial Stop loss lowest of last 2 candles and keep trailing with 50 days SMA if price close below 50 SMA then Exit or be in the trade some time trade can go for several months.
Be Discipline because discipline is the Key to Success in the STOCK Market.
Trade What you see not what you Think

EVEREADY NEAR SUPPORTEveready inds currently trading near support , if stays above 450 on weeky basis then we can see good upmove in the stock in coming sessions , build your position slowly as market i sin correction mode , keep the stoploss of 5-7 percent in youur position

Everready industry breakoutMonthly breakout of 2017 in Eveready industry with volumes.
Also a cu and handle formation.
If we look at handle 1st target will come down to 645
Stop loss can be kept at 390 in case breakout fails and not sustain.

EVEREADY - Bullish Stock name - Eveready Industries ltd.
Weekly chart setup
Chart is self explanatory everything.
Master score - B
Disclaimer : This is for demonstration and education purpose only. This is not buying or selling recommendations. I'm not SEBI registered.

EVEREADY | LONG | BROKE 7 YEAR OLD HIGHPrice is showing momentum
Need a little more basing
Volume activity is really good
Caution:
Overall market conditions are highly volatile which can impact the trade idea


Eveready Industries-Nice BreakoutEveready Industries-Nice Breakout
Capital to be deployed -20k
Investing Price -438-440
Breakout Price -438
Stoploss -377
Targets -559-654
#eveready #StockMarketindia #StockToWatch #StocksInFocus #stockstowatch #StocksToTrade

EVERYDAY GIVES BRAKEOUT ON DAILY CHARTNSE:EVEREADY
I am buying this stock
Near 380-390
And follow sl on 340
My target will be 440
My risk reward ratio is 1:1.50
Return on capital 15%"

Detailed Analysis of EVEREADY (NSE: EVEREADY)Technical Overview:
1. Breakout of Falling Trendline:
EVEREADY has recently broken out of a long-term falling trendline on the weekly chart. This breakout suggests a potential reversal in the downtrend and the beginning of a new bullish phase.
2. RSI Breakout:
The Relative Strength Index (RSI) has also experienced a breakout, indicating a shift in momentum towards the upside. This breakout adds further confirmation to the bullish bias observed on the price chart.
Trade Execution Strategy:
Entry:
Consider initiating a long position at the current market price (CMP) of 361.5. The entry point aligns with the breakout of the falling trendline and the RSI breakout, signaling potential bullish momentum.
Stop Loss Placement:
Place a stop loss at 337 to mitigate downside risk. This stop loss level is set below the breakout point to allow for minor pullbacks while still protecting the trade from significant losses in case of a trend reversal.
Target Setting:
Set a target of 386 as the first target and 419 as the second target. These targets are based on key resistance levels identified on the chart and offer attractive risk-reward ratios for the trade.
Risk Factors and Considerations:
1. Volatility:
Be mindful of potential volatility in the market, which may lead to sudden price fluctuations. Traders should be prepared to manage their positions actively to navigate through volatile periods.
2. Confirmation:
While the breakout of the falling trendline and RSI breakout are bullish signals, traders may consider waiting for additional confirmation, such as increased trading volume or bullish candlestick patterns, before entering the trade.
3. Fundamental Analysis:
Supplement technical analysis with fundamental research to gain insights into the company's financial health, industry trends, and any potential catalysts that may impact the stock's price movement.
Conclusion:
EVEREADY exhibits a promising technical setup with a breakout of the falling trendline and RSI breakout on the weekly chart. The trade is initiated with well-defined entry, stop loss, and target levels, allowing for effective risk management. However, traders should remain vigilant and adapt to changing market conditions to optimize trade outcomes.

Eveready getting ready for a breakoutEveready Industries Ltd. CMP – 355.60
Market Capitalization Rs 2,584.8Cr
Red Flags:🟥
High Valuation (P.E. = 62.5)
Declining annual net profit
Declining cash from operations annual
Green Flags:🟩
No debt
Low debt
Zero promoter pledge
FIIs are increasing stake
MFs are increasing stake
Previous Happy Candles Number – 50/100
New Happy Candles Number – 50/100
X/2 Fresh Entry/ averaging / compounding after closing above 361
Final Entry 373
Targets: 383, 397 and 411
Long term target: 425 and 441
Stop loss: Closing below 335
The above information is provided for educational purpose, analysis and paper trading only. Please don't treat this as a buy or sell recommendation for the stock. We do not guarantee any success in highly volatile market or otherwise. Stock market investment is subject to market risks which include global and regional risks. We will not be responsible for any Profit or loss that may occur due to any financial decision taken based on any data provided in this message.

ever readyEveready Industries India Ltd intends to maintain the pace of topline growth, witnessed in FY23 after many years of stagnation, with adequate profitability in this fiscal as the dry cell battery maker completed the first year under the Burman family ownership.
The company will focus on three core areas of operations — battery, flashlight and lighting — in FY24 backed by heightened promotional activities and advertising spends. It also hopes to achieve expansion in profit margin with focus on premiumisation and a new route to market strategy.

#EVEREADY 419 Tgt 519++ Buy - Rachit SethiaEVEREADY
CMP 419
TGT 519 ++
SL 360
Return ~ 24%
TF 6months
RR ~2
NSE:EVEREADY
#EVEREADY
Factors: BULLISH WEDGE BREAKOUT Trend Following Rising Volume with rising Prices. Flag pattern breakout. Pennant Pattern Breakout with Bullish Candle. Retest Successful. Higher Highs & Higher Lows. Broken above RESISTANCE levels Trading at SUPPORT levels Earnings are strong. Bullish Wedge Breakout Risk Return Ratio is healthy. And Rising from Double Bottom Pattern to Flag Pattern forming. If you like my work KINDLY LIKE SHARE & FOLLOW this page for free Stock Recommendations. With 💚 from Rachit Sethia

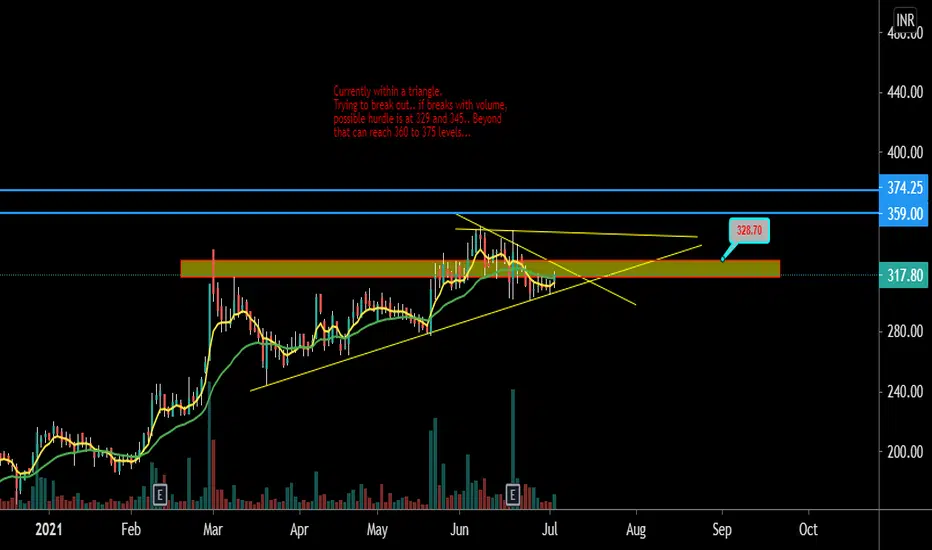
EvereadyFor the last three years the stock has been no where. Expecting a good rally at the end of this consolidation phase. All the levels are marked on the chart itself. Any major development will be posted here.

EVEREADY for Swing tradingStock looks good for Swing trading. RSI above 50 and good candlestick formation for quick target.


Multi-year breakout opportunity in @eveready industriesCup and handle chart pattern , we can wait for retest after clear break out for taking long position

#eveready #exideind #amarajabat #nippobatry #adanigreen #nhpc #I#EVEREADY
NSE:EVEREADY
NSE:EVEREADY
EVEREADY
CMP 317
ENTRY 301
TARGET 390
SL 272
RR 3
TF < 6 months
Factors:
BULLISH WEDGE BREAKOUT
Trend Following
Rising Volume with rising Prices.
Flag pattern breakout.
Pennant Pattern Breakout with Bullish Candle.
Retest Successful.
Higher Highs & Higher Lows.
Broken above RESISTANCE levels
Trading at SUPPORT levels
Earnings are strong.
Bullish Wedge Breakout
Risk Return Ratio is healthy.
And
Rising from Double Bottom Pattern to Flag Pattern forming.
If you like my work KINDLY LIKE SHARE & FOLLOW this page for free Stock Recommendations.
With 💚 from Rachit Sethia

Everyready IndiaSun Storm Investment Trading Desk & NexGen Wealth Management Service Present's: SSITD & NexGen Portfolio of the Week Series
Focus: Worldwide
By Sun Storm Investment Research & NexGen Wealth Management Service
A Profit & Solutions Strategy & Research
Trading | Investment | Stocks | ETF | Mutual Funds | Crypto | Bonds | Options | Dividend | Futures |
USA | Canada | UK | Germany | France | Italy | Rest of Europe | Mexico | India
Disclaimer: Sun Storm Investment and NexGen are not registered financial advisors, so please do your own research before trading & investing anything. This is information is for only research purposes not for actual trading & investing decision.
#debadipb #profitsolutions

EVEREADY INDUSTRIELong for tp1 -10days and tp2- 15days
Buy- 374.35
Tp1- 402.10
Tp2- 428.10
Sl- 363.40

Retest on neck line , bullish engulfing NSE:EVEREADY
Can go upside in short term if stay above neckline....
Maintain SL on closing basis below neckline

