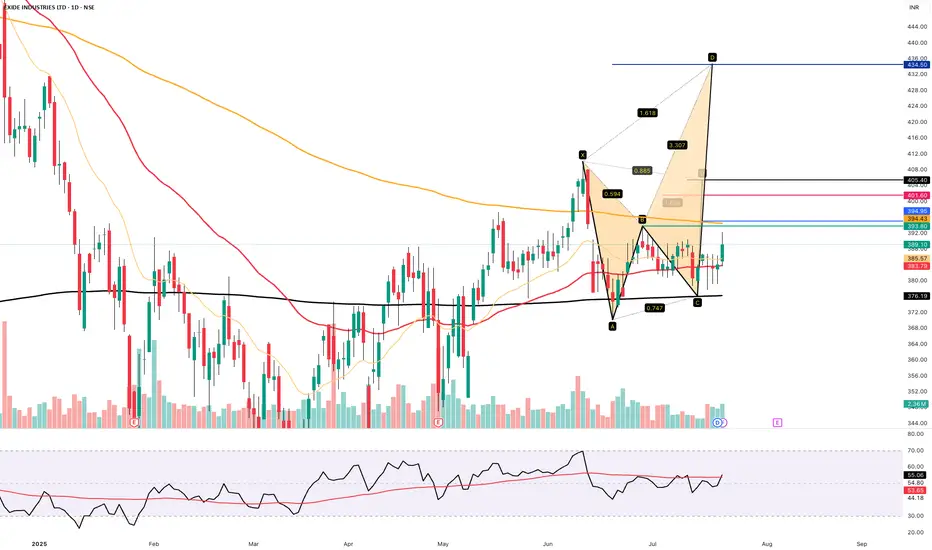
EXIDE INDUSTRIES - ABV 395 ..tgt 405/434++Exide industries ready for big breakout .... abv 394 immediate target 405
Above 405.. 434 and beyond positional
EXIDEIND trade ideas
Exide Industries Ready for the Next Bull Run !! Powering Up !!there are two chart of Exide Industries.
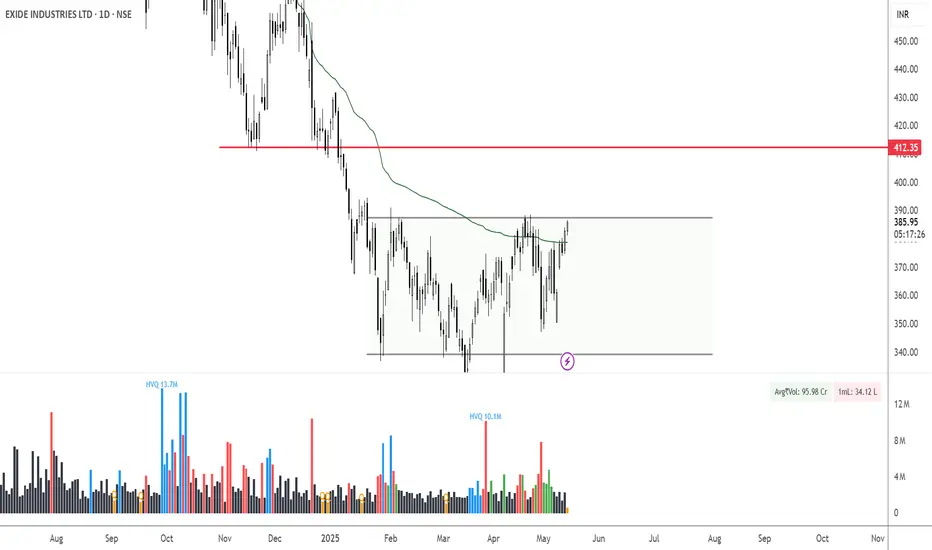
In a first chart: EXIDEIND is moving in a well defined parallel channel and currently trading near at support 365-375 range
In the second chart,EXIDEIND is respecting support at both the monthly pivot and the supertrend indicator, with the support zone positioned between ₹365-₹370.
EXIDEIND is currently sustaining below both the monthly and weekly pivot levels at ₹290. As long as the stock does not break above this pivot zone, the momentum is expected to remain weak.
If this level is suatin then ,we may see higher prices in EXIDEIND.
Thank you !!

EXIDEIND Weekly Chart AnalysisEXIDEIND Weekly Chart Analysis – Breakout Brewing?
Published: 7th June 2025
Current Price: ₹393.30 | +0.55% Today
⸻
Key Chart Highlights:
• 1D FVG Zone Cleared: Price has broken out above the fair value gap, hinting at strength
• Downtrend Broken: Price action has closed above descending resistance
• PE Target Done: ₹336.65 (Previous Put target) successfully hit
• New Target: ₹620.35 (Weekly chart target zone)
⸻
Market Bias:
As long as the price sustains above the ₹375–₹385 range (FVG base), bullish momentum is likely to continue.
If holding longs:
Trail SL below ₹372
Targeting next swing high zones: ₹472 → ₹520 → ₹620+
If rejected back below ₹375:
Wait for confirmation, as a drop may retest ₹336 again.
Summary:
A solid technical setup for positional traders – price attempting a trend reversal from the base with clear upside levels mapped.
Disclaimer: Educational purpose only. Not a recommendation. Do your own research.
12:26 PM

EXIDE INDUSTRIES SWING TRADE SETUP 📊 Price Action & Trend Analysis
Analyzing market trends using price action, key support/resistance levels, and candlestick patterns to identify high-probability trade setups.
Always follow the trend and manage risk wisely!
Price Action Analysis Interprets Market Movements Using Patterns And Trends On Price Charts.
👉👉👉Follow us for Live Market Views/Trades/Analysis/News Updates.

Exide Charging Up for a Breakout?RSI Cross + Rounding Base = Bullish Setup! 🔋🚀
🔍 Technical Breakdown
Pattern: Rounding bottom formation after prolonged downtrend.
Momentum Trigger: RSI breakout above 60 indicates fresh buying momentum.
Volume: Steady build-up in volume—accumulation phase might be over.
📈 Trade Setup
Entry: ₹372–₹373 (current breakout zone)
Stop Loss: ₹350.80 (just below recent swing low/support)
Target: ₹432.90 (previous supply zone)
📊 Indicators
RSI: 61 – strong bullish momentum
Volume: Healthy participation visible
Structure: Price curling up with consistent higher lows—indicative of strength
⚖️ Risk-Reward
RRR: ~1:3 — attractive setup for swing traders

Exide Industries xide Industries Ltd is primarily engaged in the manufacturing of storage batteries and allied products in India.
Key Points
Products
The company manufactures batteries for automotive sector like 2 wheeler, 4 wheeler, 3 wheeler, E-rickshaws and H-UPS. It manufactures batteries from 2.5 Ah for 2-wheelers to 260 Ah for Non vehicular. It also manufactures for industrial use from 7 Ah to 3200 Ah for multiple applications and for submarine uses too.
Storage Batteries Segment
The company is the leading storage batteries manufacturer in India with leader in almost all categories in Automotive, Industrial, and submarine sectors.
Lithium-ion foray
The company has forayed into this segment through:
Exide Energy Solutions Limited (ESSL): It is a WOS set-up in FY22 for lithium-ion cell manufacturing with a total project capacity 12 GWh and project cost of Rs.6,000 crore to be completed in 2 phases. It is engaged in manufacturing of advanced chemistry cells (cylindrical, pouch, prismatic). Also engaged in manufacturing, assembly and sale of battery modules and battery packs. Exide Energy Private Limited (EEPL) WoS of company, carrying the business of developing and manufacturing Li-ion based modules and packs with Battery Management System for e-mobility (EV) as well as stationary power application and having its plant at Prantij, Gujarat amalgamated with EESL with effect from Mar'24.
Company invested ~Rs. 75 Cr. (in May'24) in ESSL on rights basis. With this investment, the total investment made by the Company in EESL (including investment made in erstwhile merged subsidiary EEPL) stands to Rs. 2,377.24 Crs. till May'24 . Have a order book of ~Rs 600 - Rs 700 Crs.
Mr. Arun Mittal was appoointed as MD & CEO of EESL in May'24.
Lithium-ion cell manufacturing facility
The company is in the process of setting up a plant for lithium-ion cell production. For which it has collaborated with SVOLT (China), set up a WOS and purchased 80 acres of land at
the Hi-Tech Defense & Aerospace Park Phase 2, Bengaluru. Phase 1 to be completed by 2025.
Distribution Network
Company has a wide distribution network with warehouses and sales offices and 115,000+ direct & indirect dealers across India as of FY24. Exide has 1700+ Exide Care outlets and 300+ SF batteries Power Bay outlets.
Customer Base
The company has almost all 4 wheeler, 3 wheeler and 2 wheeler automotive companies as its customers in India.
Its industrial customers include emerson, ericsson, hitachi, Cipla, General electric, mitsubishi, godrej, BSNL, finolex, BHEL, Tata, NTPC, Indus Towers and others.
Subsidiaries & Associates
Company has 6 subsidiaries and 3 associates.
Collaborations
Company has 5 overseas technical collaborations. It has short/ long term collaborations with Furukawa from Japan; Advanced Battery, East Penn from USA; Moura (Brazil), SVOLT (China).
**Manufacturing Capabilities
Company has 13 plants (10 manufacturing & 3 lead recycling) in India with production capacity of 66 million units p.a. of automotive power, 6.7 billion ah of industrial power and 346 KMT p.a. capacity of 3 Lead Recycling Plants as of FY24. Its plants are located at Ahmednagar, Bawal, Chinchwad, Haridwar, Roorkee, Taloja, Haldia, Hosur, Prantij, Malur, Supa & Shamnagar (Cities in India).
R&D
The company has its R&D centre at Kolkata since 1976.
**Recent Developments
1. The company Launched Absorbent Glass Mat (AGM) batteries, which have higher efficiency for 4Ws in the domestic & international market
2. Extending the punched plate technology to entire range of 2W batteries, for higher quality & efficiency
3. Company designed and introduced specially optimized batteries for solar photovoltaic generation and storage applications
4. Battery energy storage systems (BESS): R&D team developed a costeffective AGM battery storage solution for BESS application
Major Updates
1. EESL(WoS) signs a non-binding MoU with Hyundai Motors and Kia for the strategic cooperation in Indian EV market.
2. Company invested ~Rs 110 Crs. in Chloride Metals Ltd(WoS) on right basisi in Mar'24.
Acquisitions
1. Company accquired 26% in Clean Max Arcadia Pvt. Ltd (a SPV) in Apr'24 for ~Rs.5.34 Cr. for genaeration and supply of solar power at Bawal factory.
KMP
1. Mr. Avik Kumar Roy was appointed as MD & CEO of the company in May'24 after retirement of Mr. Subir Chakraborty.


Lower low lower highExide industries making Lower low, Lower High. It seems market will go to 150 in up coming weeks. It is a good patter with confirmation of trend

EXIDE EXIDE
RSI Cross 60
Price Close Above EMA
Breakout with Good Volume
Buy :- 469.65
SL :- 450
Target :- 495 / 530

STOP LOSS 448 . FIRST TARGET 515 . SECOND 585 . NEXT 690Now there is a possibility of going up to 515. If the weekly candle ends higher than 515 once. Next to 585. Next goes up to 690

EXIDE NSEEXIDE has corrected from its ATH by 36%, now bouncing back from the 50% FIBO has cloded above 38.2% FIBO. Early entry can be taken with 25% quantity now and safe Traders on Day close above 515. Maintain SL at 454 the current Swing Low.
The EMAs have indicated a reversal, price currently above 50EMA and add Quantities when 20EM crosses above 50EMA.
Hold up to Target

exide updateIt seems that exide industries has completed a sequence of the 5 wave upside (terminal impulse) and we are correcting against these 5 wave completed. As the terminal impulse has a quality that it may retrace to 60-78% of the upside move, a rectangle is placed for the correction completion indication, the longs may be initiated in the rectangle area, we will then start a wave 3 upside.
This is an update to the earlier published idea.
this is not a buy or sell recommendation and is to be considered as an educational idea.

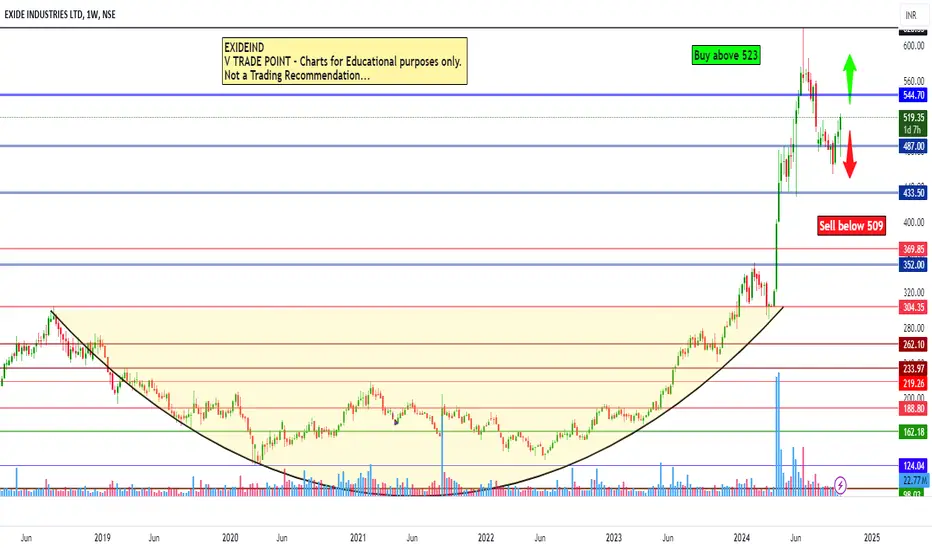
Exide Industries Ltd view for Intraday 10th October #EXIDEIND Exide Industries Ltd view for Intraday 10th October #EXIDEIND
Buying may witness above 523
Support area 515. Below ignoring buying momentum for intraday
Selling may witness below 509
Resistance area 515
Above ignoring selling momentum for intraday
Charts for Educational purposes only.
Please follow strict stop loss and risk reward if you follow the level.
Thanks,
V Trade Point
Exide Industries Set for a Bullish Rally, Target ₹577.75Exide Industries is showing a strong reversal and bullish momentum after a 10-13% correction, making it an attractive buy for swing traders. Currently trading at ₹502.40, the stock is poised to rally ahead of its quarterly results, with a target of ₹577.75 and a stop-loss at ₹465.60.
Key Technical Insights:
The stock is in a bullish reversal after its recent correction, suggesting that upward momentum is regaining strength.
Multiple RSI indicators are above 60, confirming bullishness on both the weekly and monthly charts.
Unlike most other stocks and indices that saw a 4-6% correction last week, Exide Industries remained bullish, a sign of strong relative strength in the current market.
With quarterly results due on 04 November, the stock may see a pre-results rally, similar to the more than 10% rally it experienced after the previous quarter’s results.
Conclusion:
Exide Industries presents an excellent swing trading opportunity, with a target of ₹577.75 and a stop-loss at ₹465.60.
The bullish momentum, both technically and in anticipation of upcoming results, makes this stock a strong pick in the current market environment.
Disclaimer: This is for educational purposes only and not financial advice. Please do your own research before making any investment decisions.

Exide afterva downtrend ready for upmoveAfter a correction ready for upmove, buy above 505, targetv550, sl-480

Exide afterva downtrend ready for upmoveAfter a correction ready for upmove, buy above 505, targetv550, sl-480

EXIDE INDUSTRIES BUY NOW Stock Name - Exide Industries
Trade Reason :
Weekly uptrend and correction Completed Fib - 50 % .
Take weekly Support .
4 hr - Trendline Breakout and Entry confirm .
Entry - Current Price or 478 Rs
Stoploss - 445 Rs
Target - 564.50 Rs
Expected Return - 12.35 %
Enjoyed ...

EXIDE: reversal and closure above 50 demaExide: has given closing above 50 day ema with big bar green candle.
This is a reversal indication, we may see stock rising more in coming days towards previous high.
its a strong fundamental company,
Breakout at 485 levels.
Stop less can be set at 450 levels

Exide Industry
RSI 38.89 on daily basis
RSI weekly 65
RSI monthly 81.30
Fib Retracement 0.50 level
476.80 Entry Point
454.05 Exit Point
Expected Level Swing High 618.05

One Minute Analysis of Exide IndustriesI think this video will be useful to my followers.
I put my time to show you my view on the exide industries.
All the levels are labeled in the chart. Any query? do write in the comments.
Thank you.
Disclaimer:
The information provided in this stock analysis is for informational purposes only and does not constitute financial advice. Investing in stocks involves risk, and you should consider seeking advice from a qualified financial advisor before making any investment decisions. The author of this analysis does not hold any responsibility for any losses or gains made by any reader. Always conduct your own research and due diligence before making any investment decisions.

EXIDEIND NSE:EXIDEIND
Given closing above 50 Day MA
good for Swing trade
good volume support
RSI>55
Above 500
taregt - 513/532/556
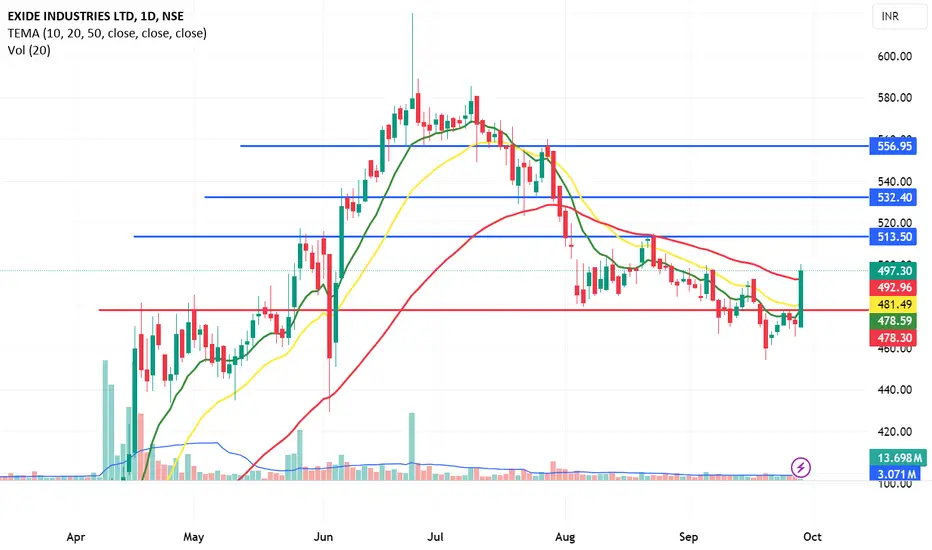
Potential Bullish Breakout Setup in Exide Industries Ltd.This daily chart of Exide Industries Ltd. highlights a potential bullish setup, with key Fibonacci retracement levels drawn from the recent swing low at ₹480.55 to the swing high at ₹514.25. The price is consolidating around the 0.618 Fibonacci level, a critical support zone, which could indicate a potential reversal to the upside.
The price is currently near the ₹504.30 level, and a move higher could lead to a significant rally toward the ₹671.35 level (100% Fibonacci extension) and possibly ₹789.30 (1.618 Fibonacci extension).
Key Levels:
Support: ₹480.30 (Fibonacci 1.0 retracement)
Resistance: ₹514.25 (Fibonacci 0.0 retracement)
Potential Targets: ₹671.35 (100% Fibonacci extension), ₹789.30 (1.618 Fibonacci extension)
Analysis: The current consolidation near the 0.618 Fibonacci retracement suggests the possibility of a bullish reversal. Traders should watch for signs of strong buying activity or bullish candlestick patterns that confirm the move higher. The key resistance levels and Fibonacci extensions offer attractive target
