Will Exide move 45% upon a monthly breakout? cmp 507Buy Exide Ind around 504 - 507 with the short term target of 560 and target as 630, 730 as medium term
Positive outlook in auto segment: Auto segment performance is expected to improve driven by uptick in domestic production levels
UPS segment is the largest business vertical in the industrial segment and is expected to grow at 10%
Exports have steadily increased from ~4% to ~10% of revenues over the last few years and the company is focused on improving the export contribution to ~15% over the next two-three years
Exide is the market leader in the auto OEM market with ~60% of the market holds the 2nd position in the telecom sector and leadership in replacement segment.
EXIDEIND trade ideas

Exide Industries intraday level fo 21st June #EXIDEIND Exide Industries intraday level fo 21st June #EXIDEIND
Buying opportunity above 577
Stop Loss area 570
Charts for Educational purposes only.
Please follow strict stop loss and risk reward if you follow the level.
Thanks,
V Trade Point

Exide Industries Intraday level for 19th June #EXIDEIND Exide Industries Intraday level for 19th June #EXIDEIND
Buying opportunity above 567
Stop Loss area 560
Charts for Educational purposes only.
Please follow strict stop loss and risk reward if you follow the level.
Thanks,
V Trade Point
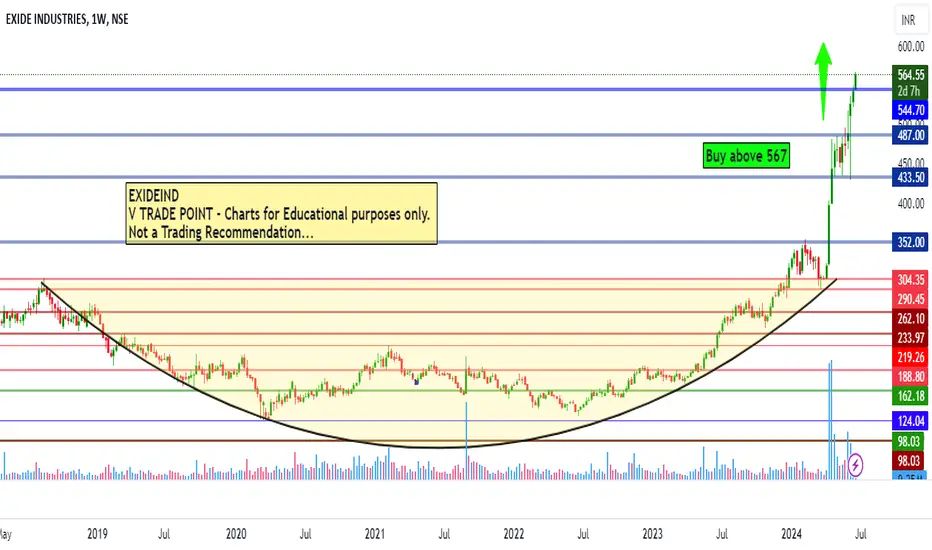
EXIDE LEVELSEXIDE Industries has been trending since April and is currently in the final phase of its uptrend. It reached a high of 549.90 on June 13 but did not surpass that level. However, it's important to note that it touched the trendline and resistance level of 549.50, which is why it fell back to 542. Nevertheless, the stock's volume and strength have been well maintained. I anticipate it will break the trendline and resistance once more to reach its uptrend target levels of 630-680, as indicated in the chart.

EXIDEIND - add in watch listAs per my analysis., EXIDEIND can be added in watchlist for for Swing trade
Buy Above 297
Stop loss as per your comfort or 260
First Target will be 365
Second Target 446
Please comment if you wish to see my analysis any stocks.
Please do your due diligence before trading or investment.
Thank you.

EXIDE INDUSTRIESThe stock after a good up move has been re-accumulating for almost a month and half. Now the stock is on the verge of breaking out from this re-accumulation zone. The relative strength is turning positive and the money flow is also on the verge of reversing. Momentum which was weak has started picking up. The volume in the last two sessions has been high. The delivery volumes is also increasing. A good close above today's high, that is a good close above 500 will take the stock to the next orbit and it will move much higher.
We had caught the earlier breakout from the Rejection zone at 280 as well.

EXIDE INUDSTRIES - Tightening squeeze EXIDE is seen in a good tightening phase with a consolidation of about 40 days on daily time frame.
Consistent QoQ growth and contracting volume.
Good to keep on your watchlist.
Disclaimer: Please be advised that the information provided is not intended as financial advice. It is imperative to conduct thorough research before making any investment or trading decisions.

EXIDEIND 1DAY1. candle with a huge red volume is acts as a
strong support and resistance
2. after a break out and retest can observe.
.
.
.
.
.
.
.
I Am Not SEBI Registered Analyst. All Post and Levels Posting is only for educational and knowledge purpose. I Am not responsible for your any kind of loss or profit.
No Claim, All Rights Reserved.‼️

Bullish Flag Pattern in Exide Industries### Pattern Analysis
- Exide Industries is forming a bullish flag pattern, which indicates a potential upward move.
- This pattern suggests a continuation of the previous uptrend after a brief consolidation.
#### Trading Strategy
- Target Placement: Place your target slightly above the indicated target level on the chart.
- Stop Loss: Keep your stop loss a little below the marked stop loss level.
Stay cautious and follow your trading plan!

Exide Industries Ltd *Exide Industries Ltd*
P&F Formation on Weekly Basis.
BreakOut above upper Flag Priceless Needed & to be Sustained. Watch it.
Strong Vol Consolidation done.
RSI: 1H >D <W <M. However, all in Bullish Zone.
EMAs: Widening Gaps amongst 20/ 50/ 100/ 200 levels on Weekly/Monthly Basis.
Sector Outlook Highly Positive for Co.
*Trail SL with Upside*
*Book Profit as per Risk Appetite*
*Do Your Own Research as well. This is an Opinion.*
*_Happy Investing _*🤓

EXPECTED BUYING IMPORTANT LEVELS FOR THE YEARHey Folks!
All the important levels are marked along with the description.
I have introduced My new concept of "Time Probability" in this chart which is marked with "YELLOW CIRCLE". In simple words expecting a reversal or a breakout when the stock is in the "YELLOW CIRCEL" .
These levels are marked for expected Uptrend.
Strategy is simple.
Entry point is the buying area .
Stoploss is the yellow line.
Targets are the upper green lines.
Club these levels with your analysis to have an edge.

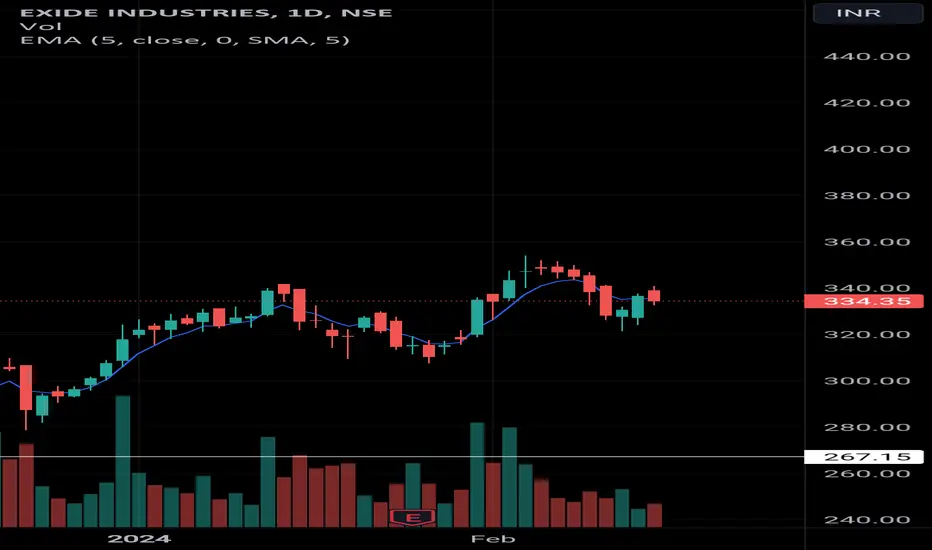
Exide Industries03/03/2024
Exide Industries
CMP 326.85
target: 335-350
SL-As per your risk
Information is only for study purpose


THIS IS EXIDEIND FOR LONGTERM INVESTMENTAs we can see stock is not very bearish as per volume fall and price fall.
Stock trading above 20 50 100 200 ema on the day
on weekly and monthly chart double bottom formation
a bullish crossover on daily and weekly
Golden crossover on 20th Oct
1st-time breakout attempt with heavy volume but can not sustain about 175
2nd-time breakout rounding bottom with good volume and sustain above 175
RSI65,
stock can retest as shown in the chart plan accordingly. in the chart, there are two long positions you can make but you the different risk-to-reward ratios you'll get.
educational purposes only!

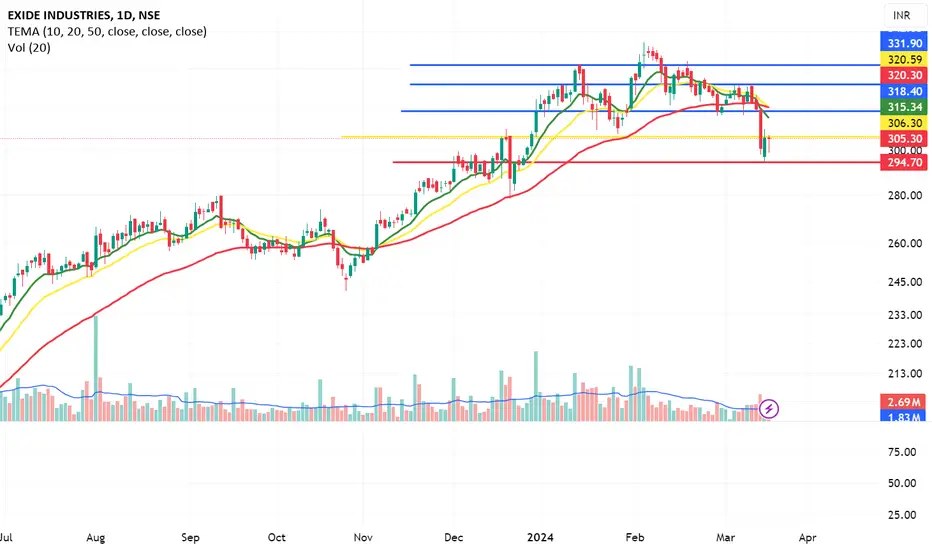
EXIDEINDNSE:EXIDEIND
Buy above 307
sl- 293
Target- 318/331
rsi near 30
chart is showing reversal
good stock for hold with sl-275
hrly rsi>45
MA(10) showing Buy
Exide Industries- One year targetWould Exide take this path to reach 375 + by the end of the year need to track the progress of Exide Energy Solutions Ltd (EESL)


Exide Industries' Stock Price Surges Beyond Fibonacci RetracemenIn this informative blog post, we will discuss Exide Industries Limited (EXIDEIND), a company listed on the National Stock Exchange (NSE) of India, whose share price has recently shown significant momentum by breaching the Fibonacci 0.236 retracement level with substantial trading volumes.
This technical analysis indicator suggests that there may be potential for further upside movement towards the next Fibonacci extension level of approximately ₹336 per share.
The current rally in Exide Industries shares is noteworthy because it coincides with an increase in trade volume, indicating increased investor interest and confidence in the stock. Additionally, the presence of a well-defined support zone near the 0.236 Fibonacci retracement level provides a solid foundation for future growth.
For those unfamiliar with Fibonacci levels, they are derived from the sequence of numbers where each number is obtained by adding the two preceding ones (e.g., 0, 1, 1, 2, 3, 5, 8, ...). These ratios are used as key reference points when analyzing market trends and identifying possible reversal or continuation patterns. In the context of Exide Industries, the breakout above the 0.236 Fibonacci level indicates that the uptrend could continue until reaching the 0.5 Fibonacci extension level, which corresponds to a price point of roughly ₹336 per share.
It should be noted that while Fibonacci extensions provide valuable insights into potential price targets, they do not guarantee specific outcomes. Investors must exercise caution and consider other factors such as fundamental analysis, macroeconomic conditions, and overall market sentiment before making investment decisions.
As Exide Industries is actively traded in the futures segment (FNO), investors have more flexibility regarding their entry and exit strategies. They can take advantage of various options available in the derivatives markets to manage risk and maximize returns. However, it is essential to understand the risks associated with derivative instruments and ensure proper position sizing and money management techniques are employed.
Overall, the recent performance of Exide Industries shares offers an exciting opportunity for both short-term traders seeking quick profits and longer-term investors looking to capitalize on the company's promising outlook.
By staying informed about the latest developments in the stock and adhering to sound investing principles, readers can make educated decisions and potentially benefit from the continued upward trajectory of Exide Industries Ltd.

EXIDE SWING TRADE OPPORTUNITY EXIDE might give a possible up move with a decent stoploss for INTRADAY to swing trade
With a good consolidation it started to move up we can grab this chance to get good returns.
ENTRY - 335
STOPLOSS - 330
TARGETS- 341, 345, 350++
NOTE- if any trade or value that's gone from the marked levels then that's not our trade just let it go or wait for it to come back
I'm not sebi registered this is my personal view

EXIDEIND MONTHLY CHARTEXIDEIND MONTHLY CHART
Cmp 305.35 Target 410-417 (MOB) Support 240
This stock has witnessed a life highs breakout & target projected for the pattern is placed @ 410-417 levels.
Its only an observation & not any suggestion.

EXIDE INDIA LONG CALLExide-india broke long term resistance and looking good for long term and positional trade.
please keep the stop loss as provided..
