Expecting Glenmark to bounce up from said pricesLet's see how it performs. Right now I am bullish on the script so will look for long entries
GLENMARK trade ideas

#GLENMARKDisclaimer - I am not a trained or registered analyst. I do this only for my learning.
I am not responsible for anyone's losses or profits.
Glenmark Pharma
Good for possible long upside for 1 : 3 RR
SL of 20 rs.
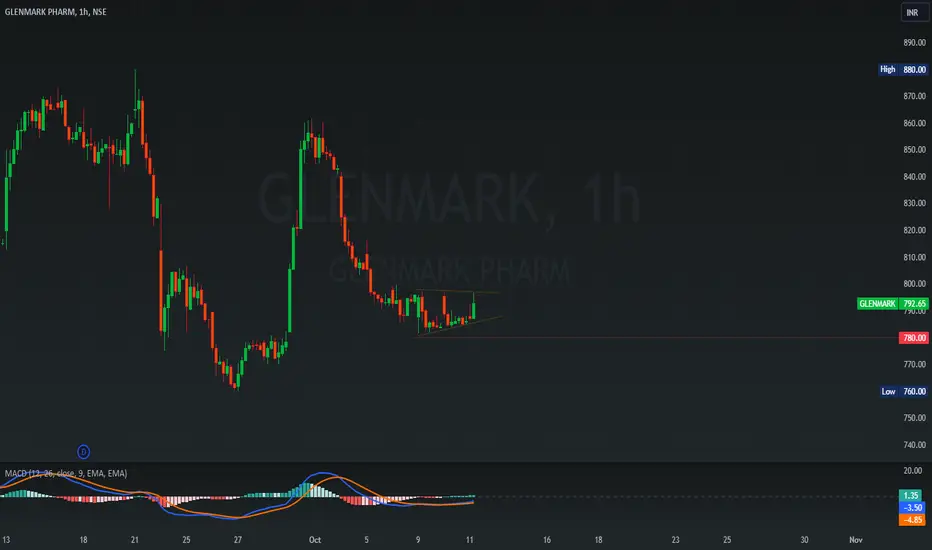
Swing highs mark the upside resistances and trendline zone is acting as support.

GLENMARK - SWING TRADE Glenmark at 792 - 793 is looking good with Stoploss 780
Target 820, 840, 860
Low Risk High Reward Opportunity...
MACD is turning Bullish on Hourly Chart...
GLENMARK BREAKOUT Glenmark breakout with huge volume, can do 950 in short term, kee the stoploss at 936 on closing basis, add this in 3 parts because market is so volatile nowadays

Triangle pattern breakout in GLENMARKGLENMARK
Key highlights: 💡⚡
✅On 1Hour Time Frame Stock Showing Breakout of triangle Pattern.
✅Strong Bullish Candlestick Form on this timeframe.
✅It can give movement up to the Breakout target of 830+.
✅Can Go short in this stock by placing a stop loss below 750-.

GLENMARK long termGLENMARK we can expected upto 1800 RS in 6 to 8 months timeframe, current it will break & retested the support, We can expected good move..

GLENMARK PHARM SHORTAfter a bull run stock make Double Top candlestick pattern on chart top. Price Break doubletop neckline, if confirmation is done price approx down approx -8%.
Good setup for short trade.
Also price break 20Dema
Macd bearish crossover
Double top target and 50Dema almost a similar price little bit differce.
Disclaimer:- This is my personal view for education purpose only.
No Buy sell recommendations give by me.

Double Top breakdown in GLENMARK PHARMAGLENMARK PHARMA
Key highlights: 💡⚡
✅On1day Time Frame Stock Showing Breakdown of Double Top Pattern .
✅ Strong bearish Candlestick Form on this timeframe.
✅It can give movement up to the Breakdown target of 710-.
✅Can Go short in this stock by placing a stop loss above 795+.

Glenmark Pharmaceuticals Ltd *Glenmark Pharmaceuticals Ltd*
Inverted H&S Formation on Yearly Basis.
Strong Price BreakOut & Sustained.
Good to Go!
Strong Vol. Consolidation / Continued BuiltUp.
Trail SL with Upside.
Book Profit as per Risk Appetite.
Do Your Own Research as well. This is an Opinion.
Happy Investing 😇

GLENMARK - BULLISH PATTERNMultiple bullish pattern are visible in Glenmark Pharma...Positionally looks good for 660 700 in medium term and then 1000 plus target in long term.

Glenmark: Trap in the making ???- We have analyzed the price action of Glenmark since 2017 on a weekly TF.
- Given that the resistance has been tested multiple times, we as investors will expect it to be weak and a break will mean an up move.
- The fact that Glenmark has given a parabolic move of 63% makes it contradictory
- If you look at the PE ratio, The PE is up like a mountain making its valuation steep
- As they say, the stock market is a paradox. The signals will always contradict.
- I would personally wait for the break and see if the price sustains. I stay biased on red.
What are your thoughts? Feel free to comment. And, If it helped, Do Leave us a boost👍.
Disclaimer: Please note that we are not registered advisors and the views expressed here are solely personal opinions. We strongly recommend consulting with your financial advisors before making any investment decisions. We like everybody else, have the right to be wrong :)

Glenmark Pharma Buy
Wave 1 and 2 are both 3 wave sequence structures and Wave 3 will be a 5 wave sequence structure as wave 2 has closed by reatracing wave 1 by more than80% and less than 100% which suffices the rules of wave 1 and 2
Price has formed a 6 Month Demand and the Target is derived as per the FIbo ratio of 161.80%
which gives a Reward : Risk ratio of 16.8:1
ENJOY THE RIDE ! ! !

GLENMARK PHARMAOne can accumulate this in range of 550-650 with the Sl Of ₹490 and Target of 950 and 1050 good breakout can be seen on a quaterly chart.. lets see if it sustains

GLENMARK PHARMA – Bullish MomentumIn Gujarati “ Bhav is Bhagwan ”
Disclaimer :
I am not a SEBI registered Analyst.
Please do your own Analysis before taking any trade/investment.
The above view is just for educational purpose only.


glenmark trend 20.03.23glenmark latest trend , sell glenmark at 447 , new buying opportunity if close above 455

Trendline Breakdown in Glenmark Pharmaceuticals Limited...Chart is self explanatory.
Disclaimer: This is for demonstration and educational purpose only. This is not buying or selling recommendations. I am not SEBI registered. Please consult your financial advisor before taking any trade.


BREAKOUT SCAN INTRADAY Stocks nearing 200 day high by 5% & showing consolidation for the past 30 days with volume above 50 day average

Downward movementCan take short for intraday. RSI in overbought zone and MACD patterning divergence and also this point is resistance level in daily chart

GlenmarkGlenmark made butterfly pattern on 30 min TF with good volumes.
Could be bought with mentioned stoploss & target in 1-2 sessions.

#GLENMARK #SANOFI #PFIZER #BPLPHARMA #MARKSANS #BIOCON #GRANULES#GLENMARK
NSE: GLENMARK
CMP: 440
TP: 515
SL: 400
TF: <6m
RR > 2 times
Return > 17%
THYROCARE CNXPHARMA LUPIN NSE:CIPLA SUNPHARMA SPARC DIVISLAB DRREDDY AUROPHARMA BALPHARMA GLENMARK SANOFI PFIZER BPLPHARMA MARKSANS BIOCON GRANULES IPCALAB LAURUSLABS NATCOPHARM GLAND ALKEM ZYDUSLIFE
Factors:
BULLISH WEDGE BREAKOUT
Trend Following
Rising Volume with rising Prices.
Flag pattern breakout.
Pennant Pattern Breakout with Bullish Candle.
Retest Successful.
Higher Highs & Higher Lows.
Broken above RESISTANCE levels
Trading at SUPPORT levels
Earnings are strong.
Bullish Wedge Breakout
Risk Return Ratio is healthy.
And
Rising from Double Bottom Pattern to Flag Pattern forming.
If you like my work KINDLY LIKE SHARE & FOLLOW this page for free Stock Recommendations.
With 💚 from Rachit Sethia
