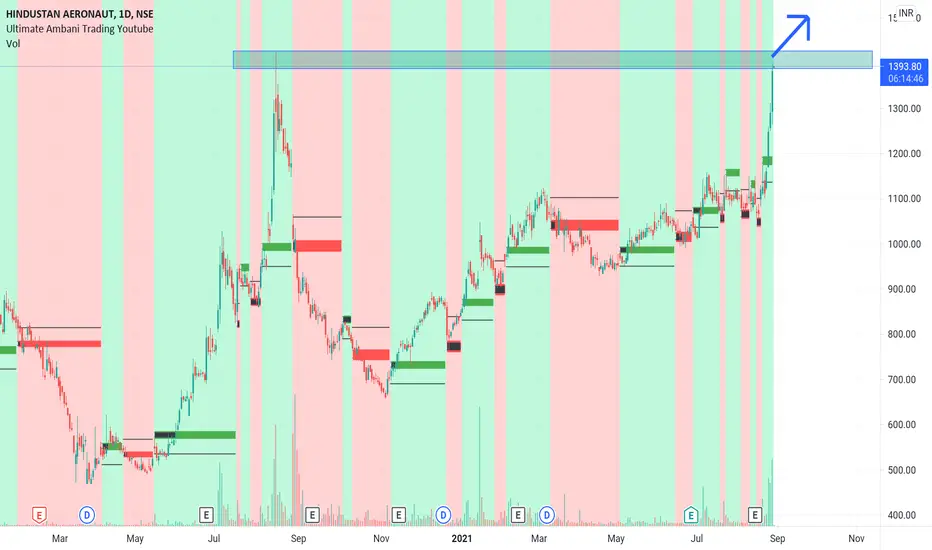
HAL AnalysisReasons To Trade:1.Trendline Breakout
2. Good Volumes
3. Long Buildup
Resistance Zone: 1375-1400
Upside Target: 1420
SL below 1310
HAL trade ideas

Trade idea on HAL with good R:RHindustan Aeronautics
Technical:
CMP: 1296
Buy after it crosses 1313 on the hourly chart and is confirmed
Targets: 1425, 1568
SL: 1230
Rational: Both wedge + FIB breakout, already seeing increase volumes
Fundamental Top 5 points:
⁃ Services entire army fleet and >70% IAF and Navy
⁃ Decreasing inventory days reducing working capital needs
⁃ Strong order book
⁃ Consistent ROE > 20%
⁃ Reducing debt and Kd at 5.32%
Quick Valuation:
⁃ Trading at a PE of 13.33x - closest peer: Bharat dynamics trades at 20+ and other New listed IPO companies: Paras defence and data patterns trade >60PE (they are however only into design)

HALStock: HAL
Entry: 1293
Analysis: Channel breakout with volumes. refer to the chart.
Please add less qty as the stock is trading below 50 DMA. As trend confirm keep adding to winning positions.
Marked multiple resistance reference.

HAL - Support at 200 emaHAL - Support at 200 ema.
A reversal is yet not confirmed here, however the risk reward ratio has turned to be highly favourable.
Excellent fundamentals and business model.
Go long with a sl of 200 ema.

HAL - Strong Uptrendprice is currently consolidation on a major trendline, on lower timeframe price is in downtrend since 18Oct, price can surge aggressively after the breakout, we've marked supply & demand zone which is a crucial level for HAL.

POSITIONAL LONG CALL NOVEMBER SERIES BUY HAL FUT Positional Long Call November Series
Buy Hal Fut @ 1370 - 1380
Support 1300 Clbs
Resistance Open To Sky 1560 +++

Breakout, retest and moving upHAL BO from triangle some days ago, retested and now moving up again....HAL is a heavy weight and an important company when it comes to defence category...targets marked. it has moved up 7% today....let us see how this pans out. This is an idea.

Hindustan Aeronautics Looks Good long Hindustan Aeronautics has consolidating near its all time highs it attempted two times to break its resistance level now it came to same level for third time if it breaks with volume confirmation it will give good move.
Stop loss should be 1340

Buy Setup with Good Risk/Reward After a nice rally #HAL was consolidating for a few days and Today its resuming its uptrend again. It seems it went into a short time wise correction and now its ready to take a leap again. Buy #HAL at market between 1380-85 with SL 1320 for targets 1600++

HAL: Waiting for break outZone of consolidation is nice and may break out with volume
Target 1200, 1400
SL 1030

HAL is a Buy around 1405 for target 1927 with sl 1144HAL is a Buy around 1405 for target 1927 with sl 1144 as per my algo


hal trade setuppossible trend reversal is noticed in the stock, overbought rsi in weekly chart onfirming a bearish candle in weekly chart followed by a short doji with long upside wick indicating a price decline can happen , setting a stoploss at 1400 on daily close it can be short for target 1315, last intrady low, breaking it it can go further low else a double bottom can be seen to resume its uptrend.

HAL .. Pole and Flag The stock has hit it all time high and consolidating in range and it can break out in any day in the coming months.... 1550 might be taken easily if it moves

HAL Bearish Gartley and Bearish Deep Crab pattern Terminal BARHAL is on Harmonic Resistance and a Reaction is possible.
Two Patterns are in progress.
(1) Larger scale Gartley Pattern with Level Hit and terminal Bar in progress today. SL for Gartley is FIB Level 1 of XA Leg. (This pattern is more visible on Weekly and Two Day Chart)
(2) Smaller Scale Crab Pattern with Fib Level Hit and Terminal BAR Completed today (This pattern is more visible on 4 Hr 6Hr and Daily)
We always play for Type-1 Reaction and we still wanna wait for Some sort of consolidation breaking down, Bearish DIV in RSI or W pattern in RSI or Reversal Candle with Volume Supported Move.
Again- Harmonics are just a way to find where Reversal comes but trend is always super and we can clearly see that trend is up and bullish.
harmonictrader.com
harmonictrader.com


HAL | Triangle Breakout | TrendLine Breakout | BuyNSE:HAL
Buy above :1075
SL : 1045
Target 1: 1115
1:2 risk reward
NOTE: This is only for information purposes. I am not an expert. Please add your thoughts in the comment.


HAL taken support from main trendline and made morning starHAL taken support from main trendline and made morning star

BREAKDOWN of HALChart is showing clear Head and Shoulder Pattern. It has also retested the breakdown levels. Targets have been shown in the graph.
