HCLTECH trade ideas

HCLTECH Price bouncing from 900 levels.
now trading above 50EMA on 30 min timeframe.
Unless it is holding marked trendline it will be in buying momentum.
No doubt its a premature entry however it is forming a pattern for a big swing trade.
Note: it has to trade above 50 EMA and take support at trendline.
This is just for an educational purpose.


Hcltech#HCLTECH
1D
Previous resistance is working as Support
Already bounce 2 times
Now again taking Support
Buy 925
Sl 880
Target 960/990/1030++
T.F. 1 month
View negative if sustain below the zone
#Chartview
#Positional

HCL Tech
Short when it breaks the bearish flag trend line.
Look out for news! Only a great news can save HCL here.

long opportunityhcl on 1 hour tfm has given a trend line break and double bottom pattern at a major weekly support zone
910 price is the neckline
break above then 930 is the target
above 930 we can reach 960 as well

HCLTECH - Consolidating for an up moveHCLTECH is consolidating near support levels, wait to cross/close abv 925 for a sharp up move. SL below consolidation box.

HCLT TECH Weekly chart LongNSE:HCLTECH
Disclaimer: The view is for study purpose only, I am not a SEBI registered person please contact your financial advisor before investing.


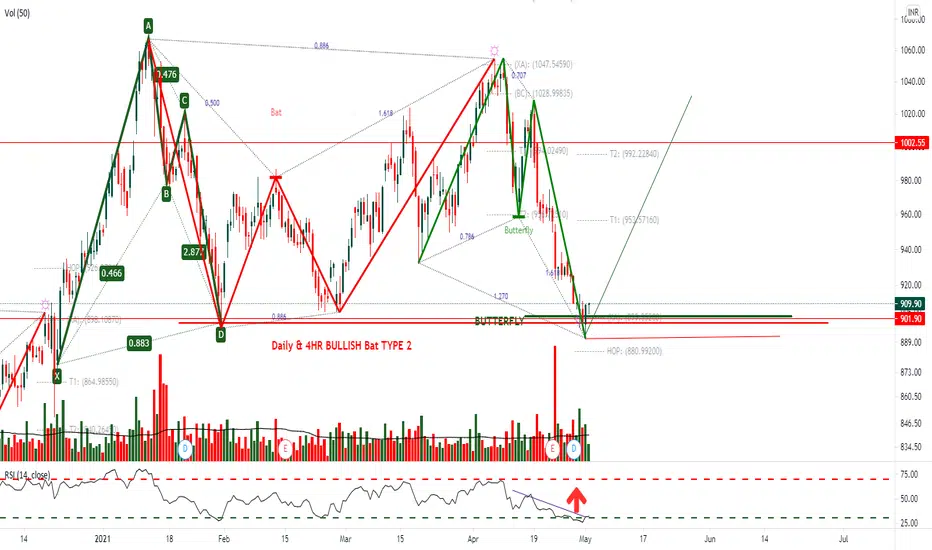
HCLTECH 4HR
Bullish Butterfly
Price need to follow GREEN TREND LINE and hit Target 1 & 2 , else if Price BREAKS RED TREND LINE is EXIT
POTENTIAL BUY
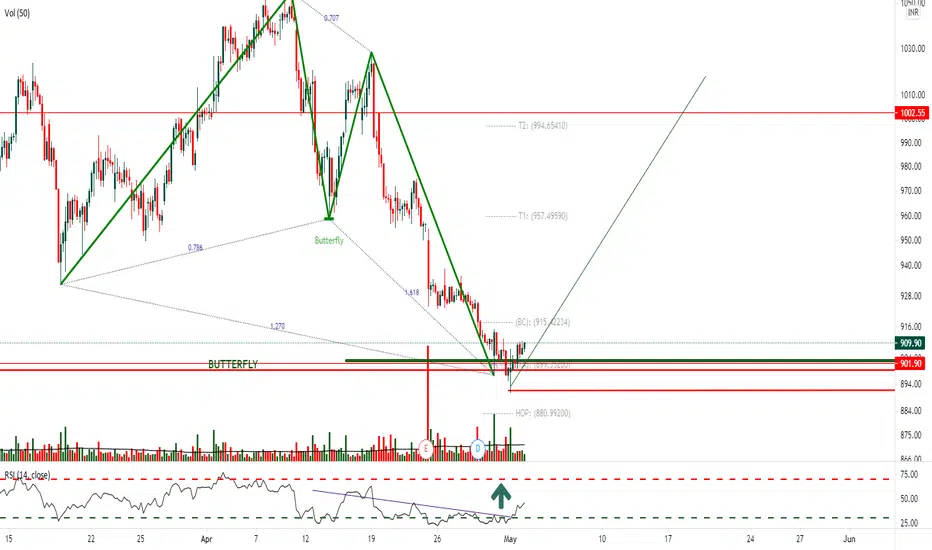
HCLTECH 1HR4HR & 1HR Bullish Butterfly ZONE
Price need to follow GREEN TREND LINE and hit Target 1 & 2 , else if Price BREAKS RED TREND LINE is EXIT
POTENTIAL BUY


HCLTECH near to strong support for reversal. Best Zone for Buy.- HCLTECH near to the strong support for reversal. Best Zone for Buy & hold.
- Joint Venture with Hitachi-ABB could be the reason for push upside in upcoming days from support level.
- Watch our next Target support level and resistance level fro entry and exit according to your target price.
- HCLTECH still continues to see large delivery positions.
- Delivery Position (05-MAY-2021 EOD ) : 46.08%
To motivate me, Please like the idea and follow If you agree with the analysis.
Happy & Safe Trading!
Vijay Singh


Swing Trade posibilitiesThe channel has been broken, and presently at the point to retest the support. Reversal seems possible to buy at 920 and set stop loss right below the previous channel.


hcltech holding imp support levelHCLTECH HOLDING IMP SUPPORT LEVEL ONCE BREAKS DOWN WE WILL SEE SOME DOWNSIDE OR IT WILL REVERSAL FROM SUPPORT LEVEL ,IF IT WAS TAKING SUPPORT FROM IT WE WILL SEE GOOD SWING TRADE. ITS ONLY FOR EDUCATION PURPOSE

