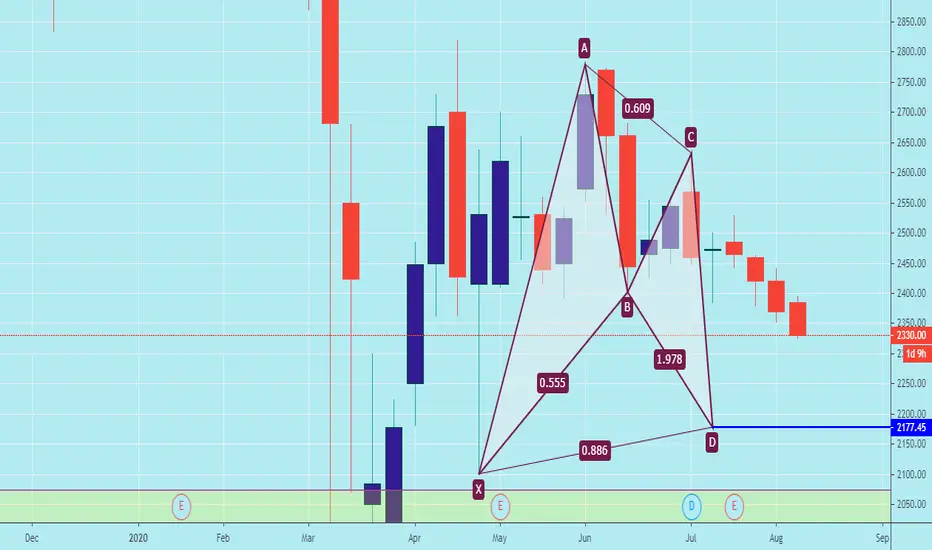
HDFCAMC Technical StrategyHDFCAMC Just broke the previous Support zones.
We can get an entry soon at lower levels of 2050/2000/1950
Just keep this stock in Radar a perfect reversal may lead this stock to new hieghts
HDFCAMC trade ideas

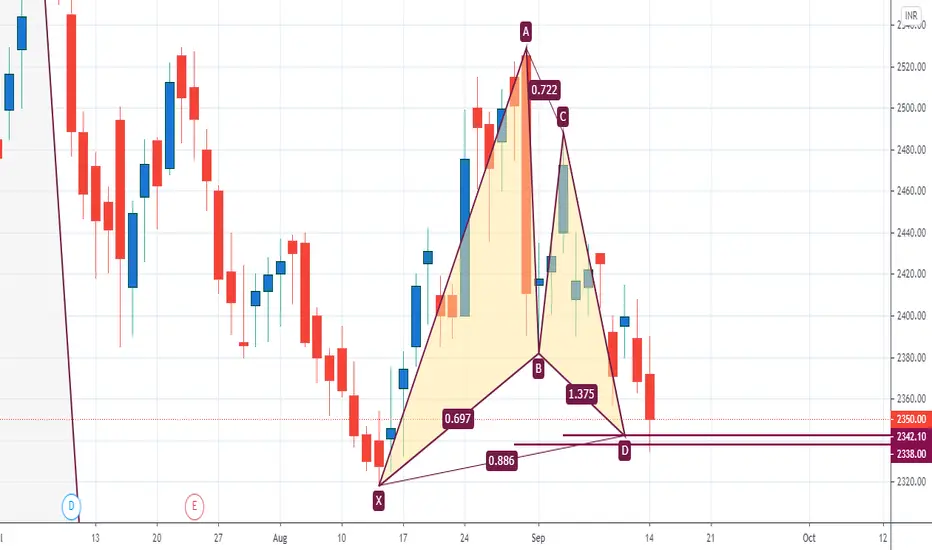
HDFC AMCONE MORE CANDIDATE IS ABOUT TO APPROACH ITS SUPPORT, IF HOLDS 2230-2250 THEN IT MIGHT REVERSE FROM HERE TO 2316, 2352 AND FURTHER TO 2400.
IF THIS SLIPS BELOW THE GIVEN LEVELS, IT WILL SEE 2215, 2172, 2130 AND 2100
**********************************************************************************************************************************************
Hi all,
Its pleasure to have you all here.
I have started putting these charts as a contribution from my side to all people who are new to business, as I had to struggle a lot without any sources at disposal. So please consider this a just small contribution from my side.
Few Honest Disclosures:
1. Any idea shared is my personal view, its not a recommendation, neither any kind of paid propaganda, so please
do your bit of research.
2. Ideas shared does not mean that I trade all or have position in them, this is just a helping hand to all.
3. I expect no comments or like nor any negativity, as I said its just a small helping hand from my side, please plan your risk and trade as per your capacity.
4. To trade in Cash, options or futures is your sole choice and your own risk
5. I am no expert in Tech Indicators, I believe in support resistance and trendline theory, you may use this as a supplement theory for better results.
6. I work for my own living, this is a hobby which I do sincerely to help anyone who might come across my charts.
***********************************************************************************************************************************************

HDFCAMC descending triangle formationAlthough a bearish pattern, one can go long above 2380 for target 2650 with strict stop loss at 2335

BULLISH MOMENTUM IN HDFCAMCPLEASE SEE CHART FOR DETAILS
TARGET : 2600
STOP LOSS : 2400
**These are my personal observations. Please trade at your own risk.**


THIS SHOWS A BEARISH TREND CLEARLY, SELL BELOW 2364 THIS SHOWS A BEARISH TREND CLEARLY, SELL BELOW 2364

HDFCAMCNSE:HDFCAMC
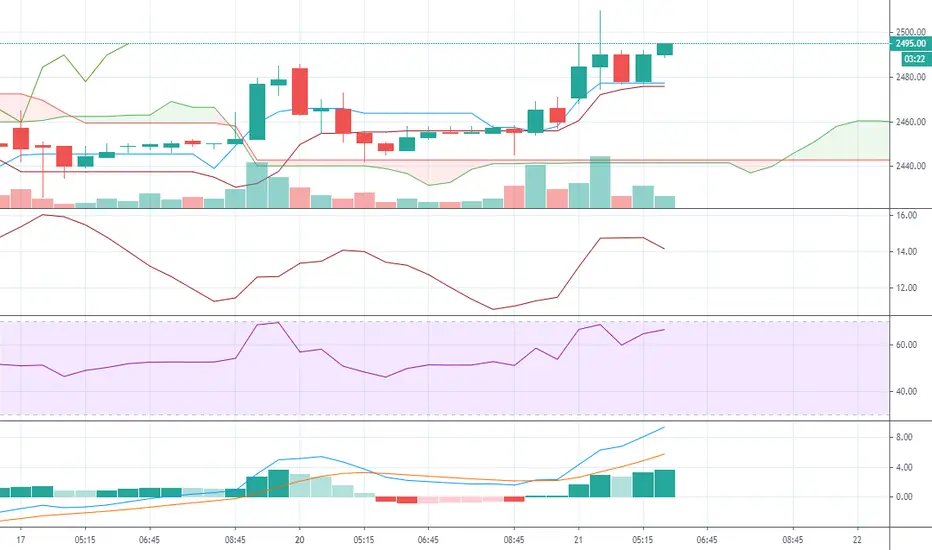
THIS HAS CRAWLED BACK TO IT SUPPORT, AND FROM HERE IT MIGHT SHOW REVERSAL
ENTRY 2370-2380
UPSIDE : 2438, 2495, 2532
DOWNSIDE : 2350, 2325, 2295 AND EVENTUALLY MIGHT TAKE SUPPORT AT 2256
KINDLY TRAIL SL, ILLIQUID STOCK, HIGHLY VOLATILE
******************************************************************************************************************************************************************
Hi all,
Its pleasure to have you all here.
I have started putting these charts as a contribution from my side to all people who are new to business, as I had to struggle a lot without any sources at disposal. So please consider this a just small contribution from my side.
Few Honest Disclosures:
1. Any idea shared is my personal view, its not a recommendation, neither any kind of paid propaganda, so please
do your bit of research.
2. Ideas shared does not mean that I trade all or have position in them, this is just a helping hand to all.
3. I expect no comments or like nor any negativity, as I said its just a small helping hand from my side, please plan your risk and trade as per your capacity.
4. To trade in Cash, options or futures is your sole choice and your own risk
5. I am no expert in Tech Indicators, I believe in support resistance and trendline theory, you may use this as a supplement theory for better results.
6. I work for my own living, this is a hobby which I do sincerely to help anyone who might come across my charts.
***********************************************************************************************************************************************

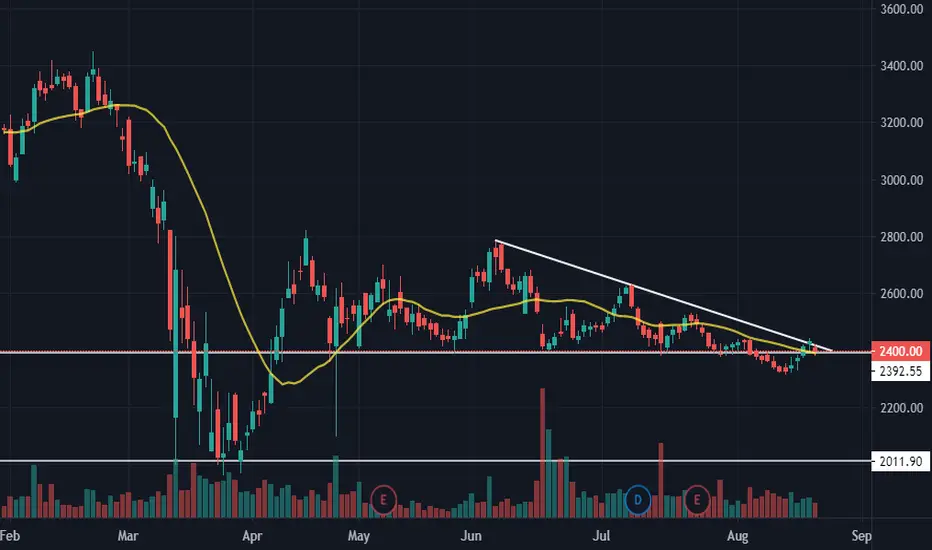
Plenty Things with HDFCAMCThis is the 5th occasion that it has come down to its support region. Earlier here a high volume was observed followed by an uptrend with price rejection ultimately encountering the resistance level of 2792. Since then it is continuously making lower highs.
It would be interesting to see whether it would take the support.
As of now its better to wait for little more confirmation before taking any trade on this.
I will keep you guys posted on this.


HDFCAMC LOOKS WEAKNSE:HDFCAMC
HDFCAMC looks like it is going to breakdown on daily candles it has formed a bearish hammer.

R-0064 Cash Buy HDFCAMC @ 2490 - 2492.50 SL 2461 TGT 2545#Intraday Cash Buy HDFCAMC @ 2490 - 2492.50 SL 2461 TGT 2545
# MACD CROSSOVER indicates buy around 2450-2460
# TK cross over on 30 min chart so again a buy for short term
# good volume on the buy side
HDFCAMC Fib SupportNSE:HDFCAMC experienced quite a lot of hesitation at higher levels after bouncing up from ~2430. After retracing from higher levels, we can see it attempting a recovery once again.
If the support is held, it could be a good swing long as long as the incoming resistances can be breached. As of now, it is just under the 13DMA (not added in the chart). So a positive Monday closing could increase strength.
HDFCAMC has typically underperformed vis-a-vis the other HDFC sister companies, but it remains to be a fairly strong pick among the various asset management companies.

HDFC AMC Gaining StrengthWill update price movements after 5 days EMA cross 50 EMA. PLEASE READ ANALYSIS IN THE CHART ABOVE.

HDFCAMC - LongReason: Hourly MIP
Caution: Shorting level is waiting in higher time frame. Take confirmation entry only.

HDFC AMC triple bottom formationTrading between the range 2400 - 2760, formed triple bottom . Go long with stop loss 2396 , short term target 2760


Range Bound - Waiting for Break Out - HDFC AMCHey Guys, Please Support - Hit Like.
HDFC AMC : One of Major listed AMCs, which has strong fundamentals and It's parenting company is India's one of the best housing finance company (HDFC Ltd). HDFC AMC has proven it's capacity of giving healthy returns. Good dividend yield.
It has faced more than 30-35% correction in it's price due to covid-19. In current time it has been consolidating between a 400 points price range,
once breakout found it can give multi fold returns to long term investors. according to technical analysis it won't see much downside from here.
RSI: is at little healthy position.
Moving Average: Price closed over 200 EMA which is a good signal.
Operator: Price is moving with volume which nullify operators presence.
Upside level & Target:
According to Fibonacci: Price is currently facing strong resistance at 0.382 level, it has tried to break this level and faced rejection.
( IT HAS SEEN IF PRICE TEST ANY LEVEL MORE THAN COUPLE OF TIMES AND FACES REJECTION ONCE IT SURPASS THAT LEVEL IT BECOMES VERY BULLISH). If price crosses 0.5 level there is a great chance that it will stay in the bullish direction.
According to Price Action: As Shown on the chart.
Nifty On Monday: According to option chain analysis
A heavy Put writing has been observed at the level of 9700 & 9500, 9400. If Nifty could not sustain the current level we can see the levels of 9500, 9400. Call writing has increased at the level of 10000 & 10200 & 10300 (RESISTANCE).
Please Share your valuable thoughts and opinion in the comment.
Please Hit Like.
Thanks.

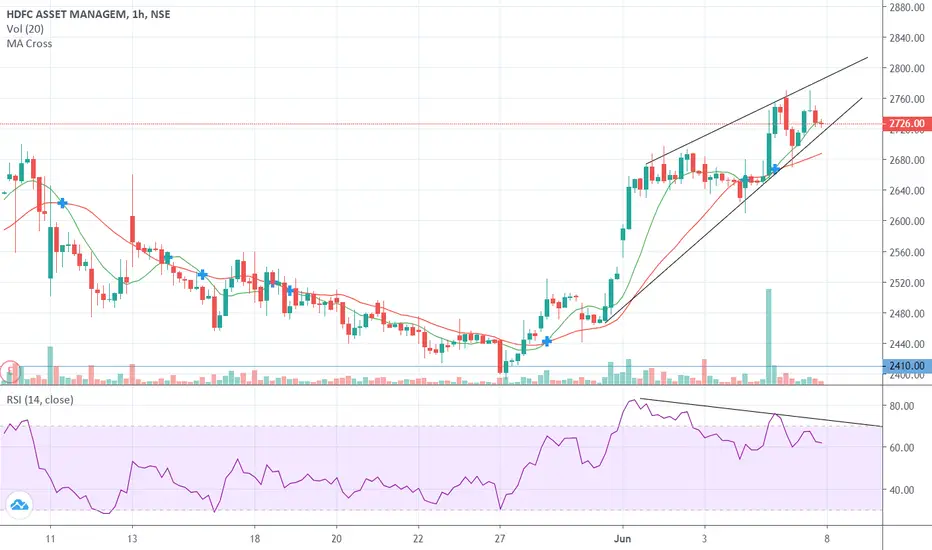
HDFC ASSET MANAGEMENT SWING TRADING BUY OPPORTUNITYHDFC AMC STOCK HAS BEEN IN BULLISH TREND IN SHORT TIME FRAME. STOCK IS TRADING ABOVE PREVIOUS STRUCTURE RESISTANCE, WHICH MIGHT ACT AS SUPPORT AFTER BEING BROKE TO THE UP SIDE. CHART HAS ALSO FORMED BULLISH GARTLEY FORMATION ON H-1 TIME FRAME. SO TRADERS CAN BUY AS PER BELOW NUMBER AS PER GARTLEY FORMATION.
BUY ENTRY: INR 2638 TO INR 2610
STOP LOSS: INR 2588
TARGET-1: INR 2689
TARGET-2: INR 2723

HDFC AMC analysis with the help of RSI IndicatorFrom the chart of HDFC AMC, we can confirm that it is showing multiple negative divergence, which is a sign of stock may slide down in near future. Wait for the confirmation, when the HDFC AMC breaks the below trend line. Always go for 1:1 Risk reward ratio for first target.