HDFCLIFE trade ideas

HDFC LIFEIt has broken the trendline and is in a positive zone, once crossed 546, next targets are 557 and 573


ascending triangle in HDFCLIFEFrom past months. HDFCLIFE has been contracting in ascending triangle movement. waiting for breakout above 550-560 range.

HDFC LIFE INSURANCE LONG POSITIONFOR ANALYSIS, PLEASE READ COMMENT IN CHART.
TARGET 630
STOPLOSS 510


HDFCLIFE - Breakout from 3 months rangeStock did a breakout from 3 month range, same structure can also be seen in the group companies like, iciciprudential, sbilife.
This breakout can probably take stock to 585 and 660 levels.
Stop can place at 485 levels.


HDFC LIFE IF BREAK LEVEL OF 424 WITH GOOD VOLUMEIT WILL GOT TO 440 LEVELS EASILY
SL 413
MACD CROSS OVER AND RANGE BREAK OUT ALSO HAPPENED


HDFC LIFE : Looks WeakThe chart is quite self Explanatory.
If the stock sustains below 500 levels, the chances are high that that stock is heading towards 472- 470 levels.
Stop can be placed at 505-507 levels.
Trade type : Swing
Risk Reward 1:3
Risk : Moderate to Low
Do your research because your are Trading at your own risk.


HDFCLIFE Life Full Support has been created Can Take the Long HDFCLIFE Life Full Support has been created Can Take the Long

get ready for hdfc life intraday breakout may be in an hourhdfc life can be considered for long term as well because of its very strong fundamentals


HDFCLIFE - TARGET DONE Refer previous post, currently the stock is not in F&O hence cannot be traded on short side.
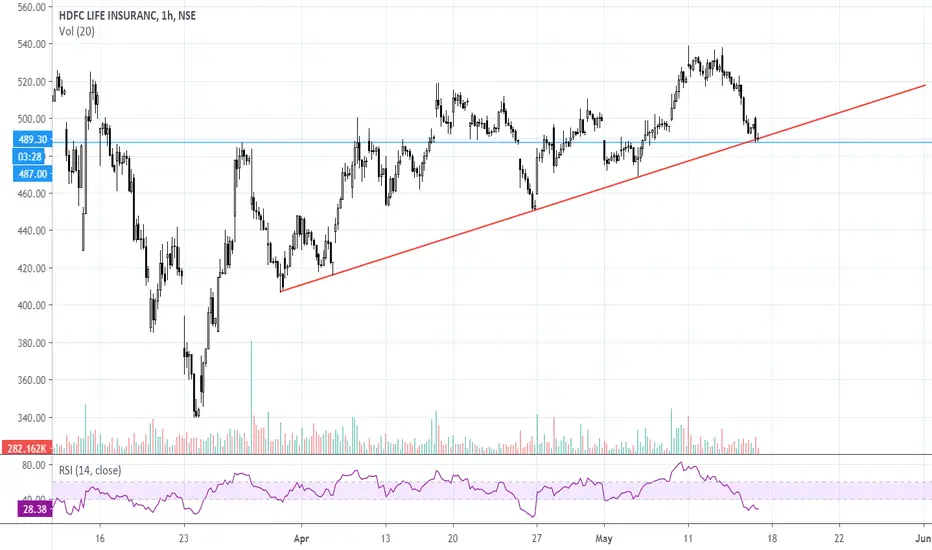
Now if it hold 490 level then its gonna resume its uptrend that it started from 340 levels.
LONG HDFC LIFE LONG HDFC LIFE FOR NEAR TARGET OF 530 AND IF YOU WISH IT CAN BE A GEM FOR LONGTERM INVESTMENT .


HDFC Life InsuranceBearish ABCD Pattern | 15 Min Timeframe
Stop Loss - 530
Sell Below - 520
Target 1 - 500
Target 2 - 490

HDFC LIFE - is the move over How far stock can still go with the following resistance at place
FiB resistance
Trendline Resistance
RSI resistance
