hdfclifehdfcife is ready to run in monthly time frame very good for long term with low risk and high reward also volume is good and perfect respect of trend line .
HDFCLIFE trade ideas

HDFC LIFE, Bullish, Kindly do your own studyThis stock is ready for breakout.
Price has takien resistance of trendline.
All EMAS PCO
Volume is good
Monthly strong price action and price has challenged upper bollinger band
Monthly MACD pco and above zero line
Monthly RSI is near 60
Weekly price has challenged Upper bollinger band
Weekly MACD uptick and above zero line
Weekly RSI is above 60
Weekly Stochastic PCO from oversold zone

Hdfc Life Long Hdfc life share one hour chart analysis . this stock start upside impulse wave .
Wave 1,2 or 3 upside complete this stock .
Current time this wave 4 downside or sideways correction
Wave 1 complete hdfc life upside Wave 2 retracment 38% to Wave 1 .
Wave 4 maximum correction down side 62 % and again price move upside break wave 5th high

HDFCLIFEThese are swing ideas which you can add your watchlist and analysis for yourself !
Keep on your radar!
This content only education purpose!
❗I am not sebi ragister❗
HDFC LIFE will take care
I want to share my market analysis
ideas with you and follow all
the rules and guidelines for analyzing
the market.
However, please note that my ideas are
based on my personal experience and
may change over time.
If there is an error in my analysis, I
am open to re-analyzing it from the
beginning and learning from my
mistakes. It's important to understand
that making an error in analysis is not a
fault, but evading responsibility is.
No one can analyze financial markets
with 100% accuracy, but it's remarkable
how close we can get.

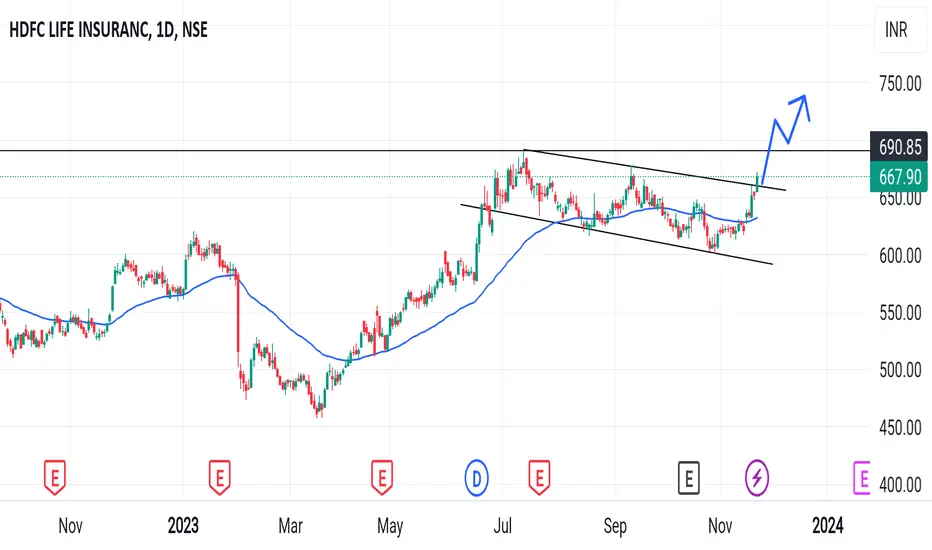
HDFC LIFEHdfc life give breakout on daily time frame . if todays closing is above the trend line, its our triggered point for planning the trade.


A new 40% wave towards 900 in HDFC LIFEHDFC LIFE INSURANCE COMPANY rallied up from 457.8 to 690.85 in a wave 1 structure beginning in march 2023 ending in July.2023.
However from July the stock got into a wave 2 correction and seems to have ended the very same in Oct. end.
The stock ended the wave 2 correction(technically a "flat" according to Elliot wave theory) at a very crucial support/resistance zone of 600 that is relevant since May.2022.
Coming to the very recent price action of the stock, the stock traded in a very narrow range for 7 days(613-626)between 1st Nov. till 9th Nov. and is now looking to break out of this range.(Generally referred to as NR7 breakout.)
The 600 level has worked as a very good support for the stock and therefore SL can be placed below it at 595-597 to try and catch the new upcoming wave that can give 40% returns going forward into 2024.
Note*- kindly try to understand the business model and key fundamentals of a company before making any investing decisions.

HDFC LIFEReverse from Support approx 614
Buy cmp approx 621
Sl 590
Target- 635(indtraday)/ 650/664/674

HDFC life $HDFCLIFE.NSE
CMP: 622.70
1. M Patten breakout
2. Big bar candle
If stock price trendline candle day closing And retest than see bearish movement !
These are swing idea's which you can add your watchlist and analysis for yourself.
Keep on radar.
This content for only education purpose!
I am not SEBI Register.

Buy signal in HDFC Life Insurance
Downward swing cycle seems to be over in HDFC Life insurance. I think we can it for 4-5% gain in next 1 week from here

HDFC Life ready to resume uptrendThe stock corrected a bit after a strong run-up. It is now giving a breakout above the correction trendline. Well positioned to buy for a short-term trade
Entry - Above 645
Stop Loss - Below 618
Target - 682/698

HDFC Life Bullish ViewMonthly Chart: MACD Line above signal line and Stochastics in positive movement
Weekly Charts : price momentum bullish divergence, stochastics potive crossover and macd failed negative crossover..
Clear bullish signal for Target 980-1000

My view on HDFCLIFEHDFCLIFE on trendline breakout.Very beautiful chart.It should give breakout above 655.
HDFCLIFE
Above 655
Tgt 665-670-680++
Keeping on radar HDFCLIFE 650 CE

HDFC life insurance stock good for buy??as per my analysis in my chart, as per smc bos happened . best dynamic support for next uppside impulse wave 590 and sl 529

HDFC Life Insurance Company LtdHDFC Life Insurance Company is engaged in carrying on the business of life insurance. The Company offers a range of individual and group insurance solutions. The portfolio comprises of various insurance and investment products.
Company is almost debt free.
Company is expected to give good quarter
Company has been maintaining a healthy dividend payout of 29.0%
IT HAS FORMED COMPLEX REVERSE HEAD NAD SHOULDER PATTERN.
ITS SHOWN BREAK OUT AND FIRST RED ARROW POINTING UPAWARDS.
SECOND RED ARROW SHOWING ENTRY LEVEL
CURRENT PRICE-634
TARGET PRICE-771
we can expect min 21% return


Looks a Great reversal candidateFundamentally at attractive level amid great oppotunity in the form of life insurance penetration in India

HDFC Life Breakout RetestHDFC life throwback to previous highs on low volume. Quick trade can be initiated if price moves above 631-632 levels

HDFC Life - Breakout on Weekly Time Frame - BullishPrice sustains above Rs. 650/- indicates bullish signal.


HDFC Life Insurance-Nice BreakoutHDFC Life Insurance-Nice Breakout
Capital to be deployed- 20k
Investing Price -670-678
Breakout Price -666
Stoploss -616
Targets -773-803-868
#hdfclifeinsurance #stockmarkets #StocksToBuy #StocksInFocus #StocksToTrade
