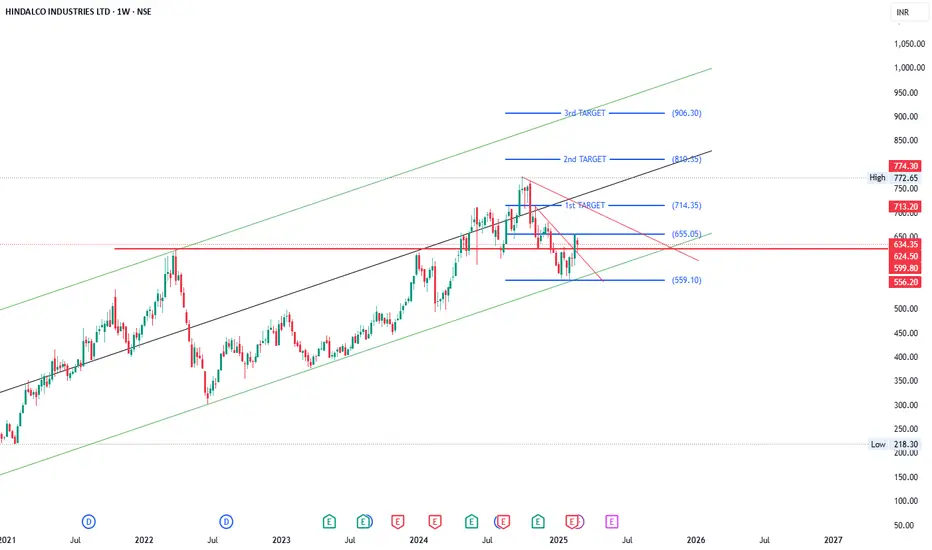
Hindalco Short_Near Resistance_Bearish Engulfing candleHindalco Short:
- Price near Resistance
- Bearish Engulfing Pattern
- SL: Today's High
- Target 20 DEMA
- Enter when price is favorable in lower timeframe
Next report date
—
Report period
—
EPS estimate
—
Revenue estimate
—
72.05 INR
160.01 B INR
2.38 T INR
1.35 B
About HINDALCO INDUSTRIES LTD
Sector
Industry
CEO
Satish P. Pai
Website
Headquarters
Mumbai
Founded
1958
ISIN
INE038A01020
FIGI
BBG000CSJRC1
Hindalco Industries Ltd. engages in the production and marketing of aluminium and copper products. It operates through the Aluminium, Copper, Novelis, and All Other segments. The Aluminium segment manufactures and sells hydrate and alumina, and aluminium products. The Copper segment is in the business of manufacturing and selling of copper cathode, continuous cast copper rods, sulphuric acid, DAP & Complexes, gold, silver, and other precious metals. The Novelis segment engaged in producing and selling aluminium sheet and light gauge products. The company was founded by Ghanshyam Das Birla on December 15, 1958 and is headquartered in Mumbai, India.
Related stocks

Hindalco Industries Ltd view for Intraday 21st May #HINDALCO Hindalco Industries Ltd view for Intraday 21st May #HINDALCO
Resistance 670 Watching above 671 for upside momentum.
Support area 650 Below 660 ignoring upside momentum for intraday
Watching below 649 for downside movement...
Above 660 ignoring downside move for intraday
Charts for Educational pu

Hindalco is giving pullback test.. Hindalco 656 is giving a pullback test. Volume pattern suggests bearishness. Below 640 we find will be bearish to drop down to 522 which could be considered for buying

Bullish on HINDALCOI put up in my earlier post last week that metal counters were looking Bullish and TATA STEEL did it's job.
Now is the turn for HINDALCO. Similar price structure, similar price action. Today morning, there has been a good breakout from congestion zone.
Long position can be built up for a Target of

Hindalco AnalysisI have analyzed Hindalco with Trend, candle pattern & Gann techniques. And found that it is looking weak. Stop loss is 716. And Target is 677,659. It is metal stock and due to global pressure it may break.

Hindalco-Bullish Swing- Very good signs of bullish momentum!
Buy above 644.05
Risk reward- 01:01
Target & Stoploss- 4.3%
1.Inside bar breakout found with bullish engulfing after forming 3 green soldiers- Good signs of momentum
2.Price has formed double bottom and hammer before reversal
3.Rejection from 0.318 Fibonacci level
4.Resistance turned to sup

Hindalco bouncing from SupportHindalco is at its Monthly and Weekly Support.
If it holds can show some theatrics as per Bullish Harmonic Pattern.
Metal Sector seems consolidating.
Do your own diligence.

SWING TRADE OPPORTUNITY - HINDALCOHindalco has taken proper weekly support, which is a nice opportunity to earn a decent profit from this script.
Missed HindalcoHindalco Completing 'W' pattern. This is the beauty of Market. No need to buy now but can see completing the pattern. Target is 676. hopes so it will give breakout after that

HINDALCONSE:HINDALCO
One Can Enter Now ! Or Wait for Retest of the Trendline (BO) Or wait For better R:R ratio
Note :
1.One Can Go long with a Strict SL below the Trendline or Swing Low of Daily Candle.
2. Close, should be good and Clean.
3. R:R ratio should be 1 :2 minimum
4. Plan as per your RISK a

See all ideas
Summarizing what the indicators are suggesting.
Neutral
SellBuy
Strong sellStrong buy
Strong sellSellNeutralBuyStrong buy
Neutral
SellBuy
Strong sellStrong buy
Strong sellSellNeutralBuyStrong buy
Neutral
SellBuy
Strong sellStrong buy
Strong sellSellNeutralBuyStrong buy
An aggregate view of professional's ratings.
Neutral
SellBuy
Strong sellStrong buy
Strong sellSellNeutralBuyStrong buy
Neutral
SellBuy
Strong sellStrong buy
Strong sellSellNeutralBuyStrong buy
Neutral
SellBuy
Strong sellStrong buy
Strong sellSellNeutralBuyStrong buy
Displays a symbol's price movements over previous years to identify recurring trends.
Frequently Asked Questions
The current price of HINDALCO is 687.70 INR — it has increased by 2.31% in the past 24 hours. Watch HINDALCO INDUSTRIES LTD. stock price performance more closely on the chart.
Depending on the exchange, the stock ticker may vary. For instance, on BSE exchange HINDALCO INDUSTRIES LTD. stocks are traded under the ticker HINDALCO.
HINDALCO stock has fallen by −1.05% compared to the previous week, the month change is a −0.63% fall, over the last year HINDALCO INDUSTRIES LTD. has showed a 4.17% increase.
We've gathered analysts' opinions on HINDALCO INDUSTRIES LTD. future price: according to them, HINDALCO price has a max estimate of 895.00 INR and a min estimate of 600.00 INR. Watch HINDALCO chart and read a more detailed HINDALCO INDUSTRIES LTD. stock forecast: see what analysts think of HINDALCO INDUSTRIES LTD. and suggest that you do with its stocks.
HINDALCO reached its all-time high on Oct 3, 2024 with the price of 772.00 INR, and its all-time low was 36.90 INR and was reached on Mar 3, 2009. View more price dynamics on HINDALCO chart.
See other stocks reaching their highest and lowest prices.
See other stocks reaching their highest and lowest prices.
HINDALCO stock is 2.45% volatile and has beta coefficient of 1.20. Track HINDALCO INDUSTRIES LTD. stock price on the chart and check out the list of the most volatile stocks — is HINDALCO INDUSTRIES LTD. there?
Today HINDALCO INDUSTRIES LTD. has the market capitalization of 1.51 T, it has decreased by −1.19% over the last week.
Yes, you can track HINDALCO INDUSTRIES LTD. financials in yearly and quarterly reports right on TradingView.
HINDALCO INDUSTRIES LTD. is going to release the next earnings report on Aug 12, 2025. Keep track of upcoming events with our Earnings Calendar.
HINDALCO earnings for the last quarter are 23.80 INR per share, whereas the estimation was 17.94 INR resulting in a 32.63% surprise. The estimated earnings for the next quarter are 17.00 INR per share. See more details about HINDALCO INDUSTRIES LTD. earnings.
HINDALCO INDUSTRIES LTD. revenue for the last quarter amounts to 648.90 B INR, despite the estimated figure of 614.58 B INR. In the next quarter, revenue is expected to reach 551.35 B INR.
HINDALCO net income for the last quarter is 52.83 B INR, while the quarter before that showed 37.35 B INR of net income which accounts for 41.45% change. Track more HINDALCO INDUSTRIES LTD. financial stats to get the full picture.
Yes, HINDALCO dividends are paid annually. The last dividend per share was 3.50 INR. As of today, Dividend Yield (TTM)% is 0.52%. Tracking HINDALCO INDUSTRIES LTD. dividends might help you take more informed decisions.
HINDALCO INDUSTRIES LTD. dividend yield was 0.73% in 2024, and payout ratio reached 6.94%. The year before the numbers were 0.62% and 7.66% correspondingly. See high-dividend stocks and find more opportunities for your portfolio.
As of Aug 4, 2025, the company has 49.21 K employees. See our rating of the largest employees — is HINDALCO INDUSTRIES LTD. on this list?
EBITDA measures a company's operating performance, its growth signifies an improvement in the efficiency of a company. HINDALCO INDUSTRIES LTD. EBITDA is 327.23 B INR, and current EBITDA margin is 13.67%. See more stats in HINDALCO INDUSTRIES LTD. financial statements.
Like other stocks, HINDALCO shares are traded on stock exchanges, e.g. Nasdaq, Nyse, Euronext, and the easiest way to buy them is through an online stock broker. To do this, you need to open an account and follow a broker's procedures, then start trading. You can trade HINDALCO INDUSTRIES LTD. stock right from TradingView charts — choose your broker and connect to your account.
Investing in stocks requires a comprehensive research: you should carefully study all the available data, e.g. company's financials, related news, and its technical analysis. So HINDALCO INDUSTRIES LTD. technincal analysis shows the buy rating today, and its 1 week rating is strong buy. Since market conditions are prone to changes, it's worth looking a bit further into the future — according to the 1 month rating HINDALCO INDUSTRIES LTD. stock shows the buy signal. See more of HINDALCO INDUSTRIES LTD. technicals for a more comprehensive analysis.
If you're still not sure, try looking for inspiration in our curated watchlists.
If you're still not sure, try looking for inspiration in our curated watchlists.