HCL Copper 1M, TF Anticipating Growth & Key Levels ⚙️ Materials: Commodity Cycle Turnaround
(Green energy metals, China recovery)
Government of India Enterprise
Hindustan Copper Limited (HCL)
The company is undergoing a significant mine expansion, projecting a 5x increase in output. This positive development is already reflected in institutional interest, with DIIs increasing their exposure by 8.2% in Q1.
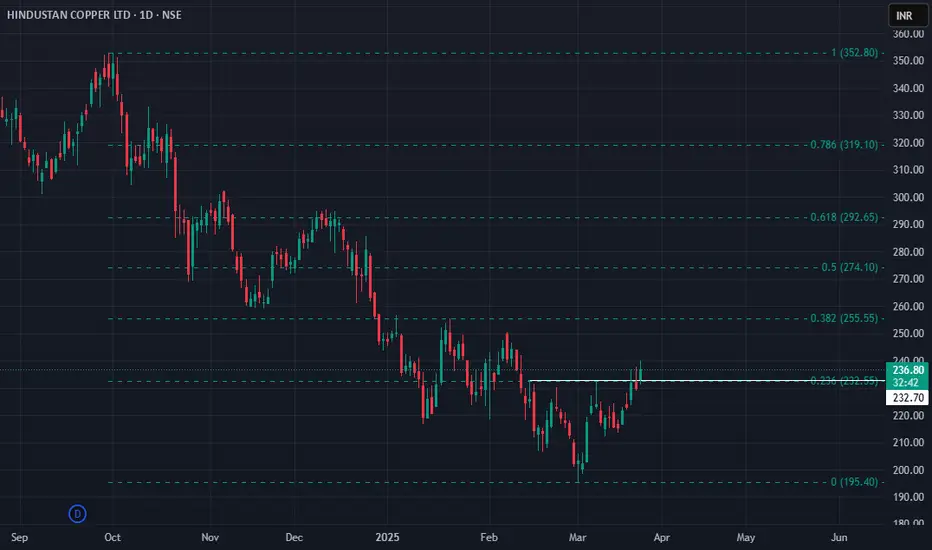
At the time of this analysis, the price stood at 273.
We've observed a volume climax at the bottom, suggesting a potential exhaustion of selling pressure and a base formation.
The white ghost candles pattern illustrate an anticipated future price path, which I project based on current market dynamics and patterns. This projection outlines a potential trajectory we will monitor closely as price develops.
A strong engulfing bullish candle formation above the 281 pivot (🔵) would signal significant bull strength and confirm a strong upward momentum.
A confirmed breakout above the monthly resistance level (🔴) would be a critical bullish signal. initiating further long positions upon a successful retest of this breakout level.
My primary accumulation zone for potential entries is identified in green (🟢 dotted), ranging between 241 and 212. This range represents an area where I anticipate favorable risk-reward for entry.
Target & Time Horizon:
While precise timing is always challenging, I estimate the projected target up to 100% ( above in the white dotted line) could be reached around Q2 2026 or before as markets perform.
Disclaimer:
This analysis represents a personal projection
based on current market observations.
Trade Safely,
Always DYOR
#हिन्दुस्तान कॉपर लिमिटेड
#indianeconomygrowth
HINDCOPPER trade ideas

HINDCOPPER , 1W , Bullishthe Pattern is already broken out and now it is at Retest point wait patiently for strong close in weekly . then enter with proper risk management , keep SL below its Swing Low
Follow for more Swing ideas like this
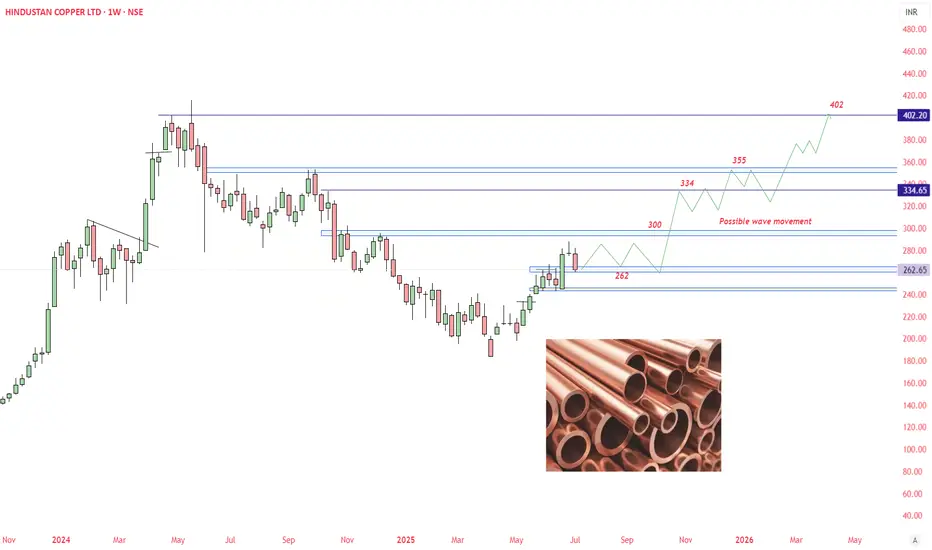
HINDUSTAN COPPER - A bullish viewLooking at copper demand in upcoming years, Bullish view are created for Hindustan copper. I have marked a wave movement that may happen during coming years.
This chart is only educational purpose. Do your own study before taking any trade or financial decisions.
#hindcopper bouncing from demand zone1)price in 75 min demand zone and demand zone is confirmed with high volume zone if we take swing from 242 to 286
2)Price rejected from 61.8 retracement level
3)Price crossing above 21 dema
4)RSI trendline breakout in 75 min timeframe
5)stock already outperforming nifty

Amazing breakout on WEEKLY Timeframe - HINDCOPPERCheckout an amazing breakout happened in the stock in Weekly timeframe, macroscopically seen in Daily timeframe. Having a great favor that the stock might be bullish expecting a staggering returns of minimum 25% TGT. IMPORTANT BREAKOUT LEVELS ARE ALWAYS RESPECTED!
NOTE for learners: Place the breakout levels as per the chart shared and track it yourself to get amazed!!
#No complicated chart patterns
#No big big indicators
#No Excel sheet or number magics
TRADE IDEA: WAIT FOR THE STOCK TO BREAKOUT IN WEEKLY TIMEFRAME ABOVE THIS LEVEL.
Checkout an amazing breakout happened in the stock in Weekly timeframe.
Breakouts happening in longer timeframe is way more powerful than the breakouts seen in Daily timeframe. You can blindly invest once the weekly candle closes above the breakout line and stay invested forever. Also these stocks breakouts are lifelong predictions, it means technically these breakouts happen giving more returns in the longer runs. Hence, even when the scrip makes a loss of 10% / 20% / 30% / 50%, the stock will regain and turn around. Once they again enter the same breakout level, they will flyyyyyyyyyyyy like a ROCKET if held in the portfolio in the longer run.
Time makes money, GREEDY & EGO will not make money.
Also, magically these breakouts tend to prove that the companies turn around and fundamentally becoming strong. Also the magic happens when more diversification is done in various sectors under various scripts with equal money invested in each N500 scripts.
The real deal is when to purchase and where to purchase the stock. That is where Breakout study comes into play.
Check this stock which has made an all time low and high chances that it makes a "V" shaped recovery.
> Taking support at last years support or breakout level
> High chances that it reverses from this point.
> Volume dried up badly in last few months / days.
> Very high suspicion based analysis and not based on chart patterns / candle patterns deeply.
> VALUABLE STOCK AVAILABLE AT A DISCOUNTED PRICE
> OPPURTUNITY TO ACCUMULATE ADEQUATE QUANTITY
> MARKET AFTER A CORRECTION / PANIC FALL TO MAKE GOOD INVESTMENT
DISCLAIMER : This is just for educational purpose. This type of analysis is equivalent to catching a falling knife. If you are a warrior, you throw all the knives back else you will be sorrow if it hits SL. Make sure to do your analysis well. This type of analysis only suits high risks investor and whose is willing to throw all the knives above irrespective of any sectoral rotation. BE VERY CAUTIOUS AS IT IS EXTREME BOTTOM FISHING.
HOWEVER, THIS IS HOW MULTIBAGGERS ARE CAUGHT !
STOCK IS AT RIGHT PE / RIGHT EVALUATION / MORE ROAD TO GROW / CORRECTED IV / EXCELLENT BOOKS / USING MARKET CRASH AS AN OPPURTUNITY / EPS AT SKY.
LET'S PUMP IN SOME MONEY AND REVOLUTIONIZE THE NATION'S ECONOMY!
Review and plan for 27th June 2025Nifty future and banknifty future analysis and intraday plan.
Swing trade.
This video is for information/education purpose only. you are 100% responsible for any actions you take by reading/viewing this post.
please consult your financial advisor before taking any action.
----Vinaykumar hiremath, CMT

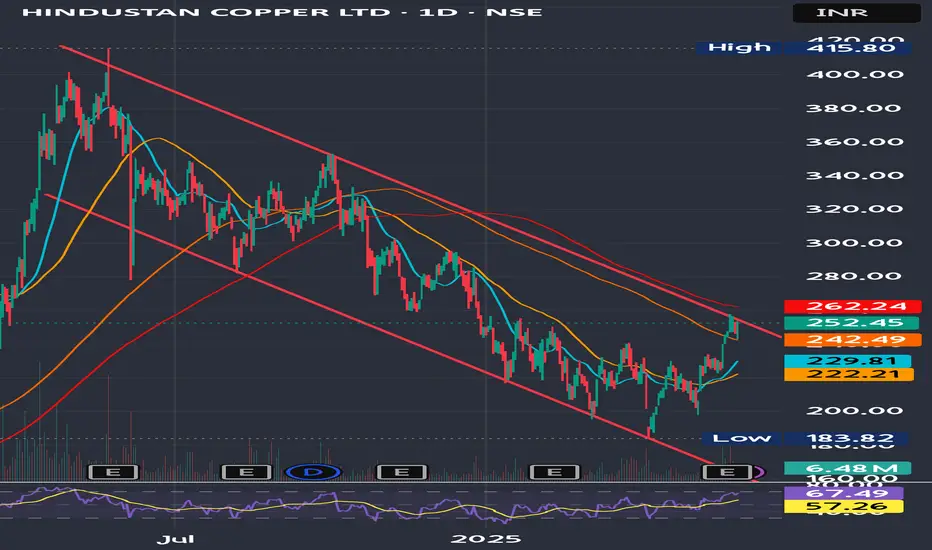
hindcopperHindustan Copper approaching a "Do or Die" zone near ₹261—confluence of resistance & falling trendline.
Bounce from 0.618 Fib at ₹201 strong.
Watch for breakout with volume — targets ₹319 / ₹415 possible.
RSI nearing overbought; short-term caution.

Hindcopper's Channel Breakout DueHindustan Copper Ltd. has recently garnered attention due to its strong financial performance and positive market sentiment.
Stock has broken out above key resistance around ₹240–₹245 with volume support.
Trend: Bullish
Indicators:
RSI ~67 (strong momentum)
MACD positive crossover
Above 50- & 200-DMA
Target Levels (Upside Potential)
Target Level Reason
270 Minor resistance zone (prior supply area)
292–295 Near-term swing high (Feb 2024 levels)
320+ Medium-term breakout target if momentum sustains
Stoploss Levels
Stoploss Type Level
Reason
Tight Stoploss 240 Previous breakout zone
Moderate SL 225 Near 50-day moving average
Positional SL 216 Breakdown confirmation below trend support
Buy on dips strategy around 245 -250 levels
Hindustan Copper Ltd view for Intraday 27th May #hindcopperHindustan Copper Ltd view for Intraday 27th May #hindcopper
Resistance 245 Watching above 246 for upside momentum.
Support area 235 Below 240 ignoring upside momentum for intraday
Watching below 233 for downside movement...
Above 240 ignoring downside move for intraday
Charts for Educational purposes only.
Please follow strict stop loss and risk reward if you follow the level.
Thanks,
V Trade Point

Hindustan Copper Ltd view for Intraday 26th May #HINDCOPPER Hindustan Copper Ltd view for Intraday 26th May #HINDCOPPER
Resistance 240 Watching above 241 for upside momentum.
Support area 235 Below 237 ignoring upside momentum for intraday
Watching below 233 for downside movement...
Above 237 ignoring downside move for intraday
Charts for Educational purposes only.
Please follow strict stop loss and risk reward if you follow the level.
Thanks,
V Trade Point

Hind Copper on the Move ??With Copper prices likely to move higher - truce on Tariff, Hind Copper seems to get into an upside mode.Above 21 ema, Jus shy of 50 ema.
Also, i'ts jus kissed the Retracement of around 61.8 & moving higher. Let see.......
#nifty
#Copper
#HindCopper

Hindustan Copper: Ready for Reversal? 🚀 Hindustan Copper: Ready for Reversal? 🚀
📉 Current Market Price (CMP): ₹237
🔒 Stop Loss: ₹210
📈 Targets: ₹256 | ₹285
📊 Why Hindustan Copper Looks Promising:
🔹 Technical Reversal Signal:
The stock has formed a small inverse head and shoulders pattern on the daily chart, indicating a potential reversal from current levels. This small base formation suggests upcoming bullish momentum.
🔹 Macro Tailwinds:
With the DXY (U.S. Dollar Index) decreasing and copper prices rising, there is additional support for an upward move in Hindustan Copper.
🔹 Swing Trading Opportunity:
With quarterly results on the horizon in April, this presents a timely swing trading setup to capture short-term gains.
💡 Strategy & Risk Management:
🔒 Stop Loss: Set a strict stop loss at ₹210 to protect capital against adverse movements.
📈 Staggered Entry: Given the recent market rally, it's wise to scale positions gradually while maintaining a balanced risk-to-reward ratio.
⚠️ Caution: While technicals are encouraging, the market has shown significant movement recently—adjust position sizes accordingly to manage risk effectively.
📍 Outlook:
With a confirmed inverse head and shoulders pattern and supportive macro factors, Hindustan Copper presents a compelling swing trade opportunity leading up to the April earnings season.
💬 Do you see this reversal playing out? Share your insights below!
📅 Follow for more technical insights and actionable market updates.
📈 #HindustanCopper #TechnicalAnalysis #SwingTrading #InvestmentOpportunities #MarketInsights #BreakoutStrategy
📉 Disclaimer: As a non-SEBI registered analyst, I encourage investors to conduct independent research or consult with financial professionals before making investment decisions.
Hindustan Copper Short TradeHello,
Trend-Based Analysis. Buy the Dips, Sell The Rallies, Also Following the Trend. Let's see where the Price Action takes us, Riding the wave. Potential trade setups based on trend momentum.
Technical analysis based on trend identification and momentum, Looking for high-probability setups within the prevailing trend.
Analyzing the current market trend and potential future price movement. Focusing on risk management and reward-to-risk ratios.
Details is Mentioned in Chart, Read carefully.. .

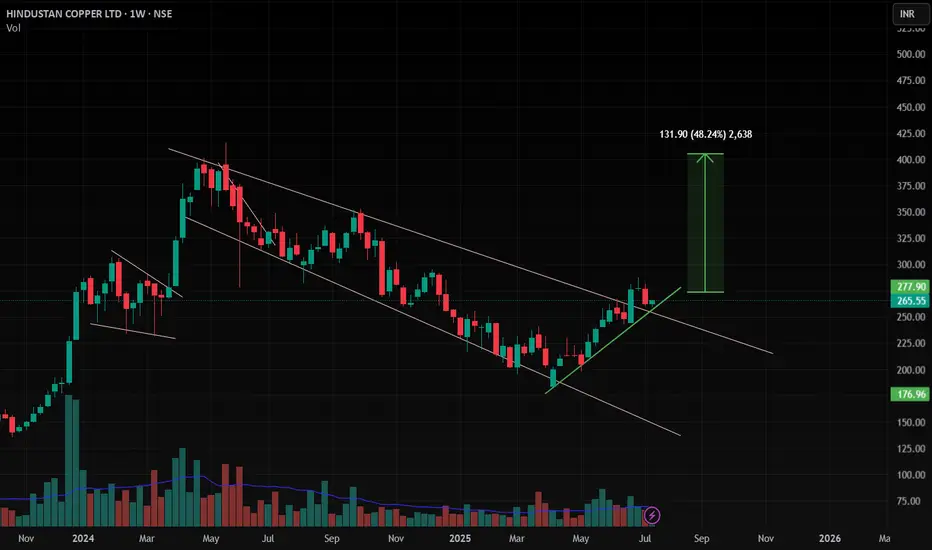
HINDCOPPER : Riding the Liquidity Zone for a Strong Upswing1. Hindustan Copper Ltd. (HINDCOPPER)
Current Price: ₹283.45
Chart Observations:
The chart showcases a corrective wave labeled as A-B-C, where Wave (C) has approached a liquidity zone (₹252–₹268). This zone is supported by a deep retracement from the last swing low, aligning with Fibonacci 113%–127% levels, making it a potential demand zone.
A Break of Structure (BoS) at the earlier swing low indicates seller dominance; however, the liquidity zone offers a counter-trend opportunity.
A sharp upward projection anticipates price moving toward the target zone between ₹364 and ₹378.
Buying Levels:
First buying opportunity: ₹268–₹283 (inside the liquidity zone).
Secondary aggressive entry: On confirmation of a bullish breakout above ₹292.
Stop Loss:
Place the stop loss at ₹252 . Use a dynamic trailing stop-loss strategy by adjusting it above the next immediate swing low as the stock advances.
Target:
First Target: ₹364
Second Target: ₹378
Pro Tip to Avoid SL Hunting: Monitor for rejections (e.g., long wicks, higher lows) at ₹268 levels before entering. Wait for confirmation of demand in this zone on shorter time frames like 1-hour or 4-hour charts.
Disclaimer: This analysis is for educational purposes only . Investments in stocks and financial markets involve risks, including the loss of principal. Always conduct your own due diligence or consult with a certified financial advisor before making any investment decisions.

Long Term Investment Pick : HINDCOPPER LTP: 263
Targets: 280 / 303 / 324/ 348 🤞🏻
Long-term:370 / 403 /486 / 566 🤞🏻🤞🏻
May add on dips till 230-200 .
For investors with a long-term perspective and the ability to add on dips or to hold calmly.
Time Frame: 4 to 10 months 🤞🏻
Trade/invest/track as per your risk management and investment plan.

HINDCOPPER 12year Price BreakoutHINDCOPPER has closed above the previous 12Year weekly and Monthly High of 316.5 forming a Rounding Bottom CUP. The Rest of this level is now done and price is ready to move upwards
HINDCOPPER has a ATH of 658 this is the Target
The Price is currently above the 50EMA and 20EMA a has recently crossed over the 50EMA clearly indication an upward trend
Volumes too have been significant for the past 5 weeks and growing in the last three weeks.
MAINTAIN A SL of 290 (200EMA) for DAY close

HINDCOPPER BUY Stock Name - HINDCOPPER
Trade Reason :
Weekly Strong uptrend
Trend Reversed .
Some opportunity are there , Market travel channel Top coming to Bottom Take trade for
conservative Trader.
Aggressive Trader entry Now .
Entry - 323 Rs
Target - 386 Rs
Stoploss - 282 Rs
Expected Return - 19.50 %

HINDUSTAN COPPER LTD S/R Support and Resistance Levels:
Support Levels: These are price points (green line/shade) where a downward trend may be halted due to a concentration of buying interest. Imagine them as a safety net where buyers step in, preventing further decline.
Resistance Levels: Conversely, resistance levels (red line/shade) are where upward trends might stall due to increased selling interest. They act like a ceiling where sellers come in to push prices down.
Breakouts:
Bullish Breakout: When the price moves above resistance, it often indicates strong buying interest and the potential for a continued uptrend. Traders may view this as a signal to buy or hold.
Bearish Breakout: When the price falls below support, it can signal strong selling interest and the potential for a continued downtrend. Traders might see this as a cue to sell or avoid buying.
20 EMA (Exponential Moving Average):
Above 20 EMA(50 EMA): If the stock price is above the 20 EMA, it suggests a potential uptrend or bullish momentum.
Below 20 EMA: If the stock price is below the 20 EMA, it indicates a potential downtrend or bearish momentum.
Trendline: A trendline is a straight line drawn on a chart to represent the general direction of a data point set.
Uptrend Line: Drawn by connecting the lows in an upward trend. Indicates that the price is moving higher over time. Acts as a support level, where prices tend to bounce upward.
Downtrend Line: Drawn by connecting the highs in a downward trend. Indicates that the price is moving lower over time. It acts as a resistance level, where prices tend to drop.
RSI: RSI readings greater than the 70 level are overbought territory, and RSI readings lower than the 30 level are considered oversold territory.
Combining RSI with Support and Resistance:
Support Level: This is a price level where a stock tends to find buying interest, preventing it from falling further. If RSI is showing an oversold condition (below 30) and the price is near or at a strong support level, it could be a good buy signal.
Resistance Level: This is a price level where a stock tends to find selling interest, preventing it from rising further. If RSI is showing an overbought condition (above 70) and the price is near or at a strong resistance level, it could be a signal to sell or short the asset.
Disclaimer:
I am not a SEBI registered. The information provided here is for learning purposes only and should not be interpreted as financial advice. Consider the broader market context and consult with a qualified financial advisor before making investment decisions.

Positional Trade Alert: HINDCOPPER The stock has surged 22% from the bottom and is nearing a breakout point above ₹345, with potential for a 22% upside! 📈
🔸 Entry: Above ₹345
🔸 Target: ₹420
🔸 Stop Loss: ₹320
The cup-and-handle formation indicates a bullish continuation. Watch out for this move! 🚀 #StockMarket #PositionalTrade #TechnicalAnalysis #HindCopper

Take a look at hind copperbuy above 330
Taret could be 350,400, 600 may not possible due to weak fundamental
SL 310
for educational purpose only and not buy/sell recommendation

Hindustan Copper Ltd.(NSE:HINDCOPPER) Your chart shows **Hindustan Copper Ltd.** (NSE:HINDCOPPER) on a **weekly timeframe**, with various technical indicators and levels highlighted. Here’s a breakdown of what I see in the chart:
1. **Price Action & Trend:**
- The stock has recently made a significant upward move and is trading around **₹329.80**.
- There's a visible breakout around **September 4, 2024**, which has been marked as a **monthly/weekly breakout**.
2. **Key Resistance Levels:**
- **2010 old resistance level** is marked around **₹655.60**, indicating a major price resistance from a historical high.
- **2012 old resistance level** at **₹415.80** suggests another strong resistance point, which the stock might face in the near term.
3. **Indicators:**
- **Moving Averages:** A blue line and a white line, which seem to be two moving averages (possibly 50-week and 200-week) are being plotted. The stock price is above both these moving averages, which indicates a bullish trend.
4. **Volume:**
- There was a spike in volume during the recent rally, indicating strong buying interest during the breakout.
5. **Relative Strength (RS) & Net Income:**
- The green line in the lower panel shows **Relative Strength** (RS), indicating a dip in the stock’s strength over time.
- The blue boxes represent **Net Income**, and it seems to be fluctuating over the quarters, which might affect the stock’s strength.
6. **Support Levels:**
- There's a visible support zone near **₹291.75**, which appears to be acting as a strong support level. The price may have tested this level recently and bounced off.
7. **Take Profit & Risk Levels:**
- The **91.12% profit target** is marked, suggesting a large upside potential if the stock continues its upward momentum.
### Summary:
- **Bullish Momentum:** Hindustan Copper has had a recent breakout, and the price is well above the moving averages, suggesting continued bullish momentum.
- **Key Resistance:** Keep an eye on the **₹415.80** level from 2012 and **₹655.60** from 2010, which might act as strong resistance.
- **Support:** The **₹291.75** level is an important support zone to watch if the stock retraces.
For a deeper analysis of Hindustan Copper based on the chart you've shared, let's break down the potential strategy and key areas to focus on:
1. Trend Confirmation:
The 50-week and 200-week moving averages indicate a long-term uptrend since the price is comfortably above both. This signals that the overall trend is still bullish. As long as the price stays above these averages, it’s a positive sign for further upward movement.
2. Support & Resistance Levels:
Support at ₹291.75: This zone has been tested before and held, indicating strong buying interest. If the price retraces, this is a good level for re-entry or adding positions.
Immediate Resistance at ₹415.80: This is a significant level from 2012, and the stock could face selling pressure here. A clean break above this resistance could propel the stock towards the ₹655.60 level, which is another major resistance from 2010.
3. Breakout Dynamics:
The breakout on September 4, 2024 signifies that the stock could be entering a new phase of price discovery. The volume spike during this breakout strengthens the validity of the move.
However, price seems to be consolidating slightly after the breakout, suggesting the possibility of a retest of lower levels (potentially near ₹291.75).
4. Risk/Reward Setup:
Stop-Loss Placement: Based on the support and trendlines, placing a stop-loss slightly below ₹291.75 seems reasonable to protect against a deeper correction. If the price falls below this, it could indicate a break in the current bullish trend.
Target Levels:
Short-term Target: ₹415.80 (resistance from 2012).
Medium-term Target: ₹655.60 (resistance from 2010).
The chart marks a 91.12% profit target, which likely points towards a long-term target near ₹650+.
5. Indicator Insights:
Relative Strength (RS): Currently, the RS shows a dip, suggesting that the stock’s upward momentum is slowing down. Watch for any signs of divergence or further weakness in the RS, which could indicate a reversal.
Net Income: The blue lines representing net income show fluctuations, which means the company's financial performance is unstable. This might impact long-term sentiment, so checking future earnings reports will be important to confirm that fundamentals align with technical momentum.
6. Potential Trading Strategy:
For Long Entries:
You could enter now if you believe the recent consolidation is temporary and the stock will resume its upward trend.
Alternatively, wait for a retest of the ₹291.75 support or a confirmed breakout above ₹415.80 before entering.
For Profit-Taking:
A short-term target could be ₹415.80.
For more aggressive targets, aim for ₹655.60.
Stop Loss: Keep it just below ₹291.75 or under one of the moving averages for safety.
7. Considerations:
Fundamentals Matter: Given that net income is fluctuating, pay attention to the company’s financial health, especially in the next earnings report. If the fundamentals worsen, it might affect the stock’s upward momentum.
Market Sentiment: Since this is a commodity-based stock (copper), the global demand for copper and commodity prices will play a significant role. Keep an eye on macroeconomic conditions affecting metal prices.
**Disclaimer:**
The information provided here is for educational and informational purposes only and should not be considered as financial or investment advice. Trading in the stock market, particularly in commodities or volatile sectors, carries a high level of risk and may not be suitable for all investors. Before making any investment or trading decisions, it is important to do your own research, consider your financial situation, risk tolerance, and consult with a professional financial advisor if necessary.
Past performance is not indicative of future results, and all investments carry risks, including the potential for loss of principal. The analysis provided is based on technical data and chart patterns, which may not fully capture underlying fundamental factors that can influence market outcomes.
You are solely responsible for any trading or investment decisions you make.

HINDCOPPER's base seems to have formed here!!!There are too many reasons to enter the stock!
The stock is at the support of 100ema and 200ema!
Fibo levels too signal a good entry point!
Risk here is minimum!
The stock also bounced back from previous swing high!
A perfect stock for #day25!

Hindustan copper favourite from 130 rs Hindustan Copper 270 -280 is strong support , my target view is 400-500 current price is 307 rs .
