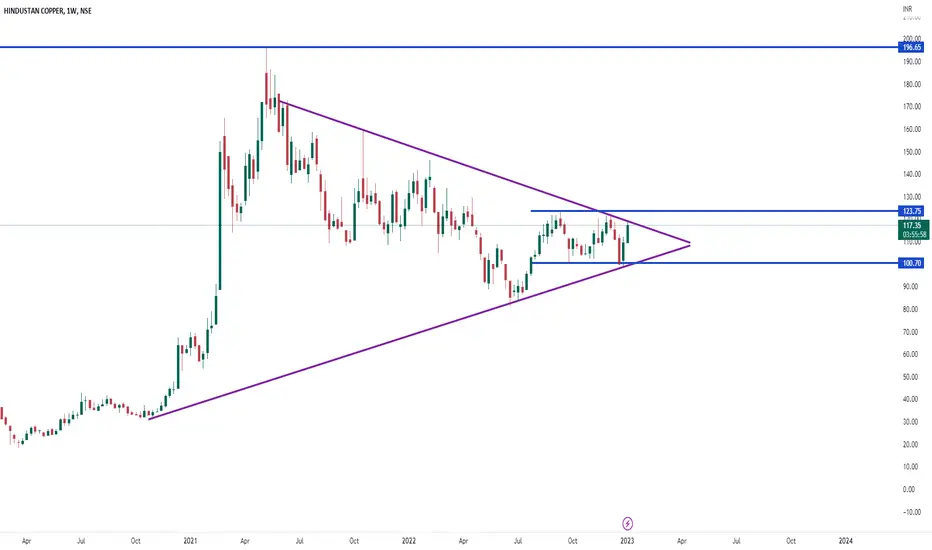
HINDCOPPER : Neutral : No trendAs calm as a dead sea.
No ripples. No wave. No trend.
I believe many investors are stuck at higher levels, they will come as a tsunami at every rise and keep the stock sideways.
HINDCOPPER trade ideas

Hindustan Copper- Bullish | 25% growth expectedThe price was consolidating in an Inverse head and shoulder pattern near the daily support areas.
The price broke out of the neckline, which is the first sign of bullishness. After the breakout on 2/5/23, the next day price even retested the neckline which confirms the pattern breakout. On 4/5 price advanced further and now facing resistance near 108 horizontal resistance and 200dma.
Once daily closes above 200dma and 108.5-109 horizontal resistance, go long.
Stop Loss- Below the lows of breakout candle with some buffer.
Targets
1. 121
2. 131
Remember to keep trailing your stop loss and move stop loss to entry once Target 1 is achieved.
Also, do follow Risk management and Position Sizing.

Weekly Breakout - Small SLFollow Strict SL
PS : Only for learning purpose. Please consult your financial advisor before investing.

more value is there , compare with copper futuresee the chart of copper future and then think about this stock for more value that you can create

HINDCOPPER - Weekly AnalysisIn the Weekly Chart of HINDCOPPER ,
we can see that, it has formed a Bullish Hammer at Clone Trendline.
We can see a Up move in W Pattern.

HINDCOPPERIn the Daily chart of HINDCOPPER ,
we can see that, Inverted Head & Shoulder has failed thrice.
100 level looks important but it has also been tested twice.
lets see it forms some bullish pattern and goes in upward direction or take the support below 100.

Hindustan Copper (HINDCOPPER)I think this stock will be a multi bagger stock because due to increasing demand of copper for EV's and cables and many other uses of the copper and it is government holding and biggest player in copper of India.
DISCLAIMER - IT'S MY STUDY PONTS NOT ANY RECOMMENDATION. THIS IS ONLY FOR STUDY PURPOSE.
#stockanalysis #governmentstock

HINDCOPPER - LongHindCopper - It has given breakout on daily chart. Next TGT would be 145, then 155 in near term. Trade cautiously, I will buy on pullback (110-100) or will leave it.

HINDCOPPER Hindustan copper MonthlyHindustan copper the monthly chart price and volume say the something, I am bullish in the long term, the volume in the last few month is very high.

Long In HINDCOPPERThe resistance zone is of year 2014 (kindly check monthly chart) . After a failed breakout earlier the stock is headed towards a fresh breakout. This can be seen along with increasing volume.
If weekly candle close above 126 this week can go long with target as shown in chart with a SL of low of the weekly candle ( keep some margin below the weekly candle).
This is only for education purpose only. Kindly do your own analysis before taking entry.

Hindustan copper: breakout soonHindustan Copper is a potential breakout stock on weekly chart analysis. keep it on your radar.

HINDUSTAN COPPER LTD - Keep an Eye + Double Bottom Pattern 📊 Script: HINDCOPPER (HINDUSTAN COPPER LIMITED)
📊 Nifty50 Stock: NO
📊 Sectoral Index: NIFTY METAL
📊 Sector: Commodities Metals & Mining
📊 Industry: Non - Ferrous Metals Copper
Time Frame - Daily
Script is forming Double Bottom Pattern as shown in a chart.
Key highlights: 💡⚡
📈 Script is trading at upper band of Bollinger Bands (BB) and giving breakout of it.
📈 MACD is giving crossover.
📈 Double Moving Averages also giving crossover.
📈 Volume is increasing along with price which is volume breakout.
📈 Script may give breakout of Double Bottom Pattern.
📈 Current RSI is around 65.
📈 One can go for Swing Trade ONLY ABOVE 125.
BUY ONLY ABOVE 125
⏱️ C.M.P 📑💰- 123.40
⚠️ Important: Always maintain your Risk & Reward Ratio.
⚠️ Purely technical based pick.
✅Like and follow to never miss a new idea!✅
Disclaimer: I am not SEBI Registered Advisor. My posts are purely for training and educational purposes.
Eat🍜 Sleep😴 TradingView📈 Repeat🔁
Happy learning with trading. Cheers!🥂

Hind Copper BreakoutHind copper has given proper break out, we can see some upside from here, buy from current level 123 and keep a stop loss at 113, and target could be 135+

HINDUSTAN COPPERDay chart of hindustan copper in which support and resistance is trendline above 125 level it can be bullish and below 100 level it can be bearish let's see in which side it give momentum.
Hindustan Copper Mean (EMA) Diversion on Daily time frame*Hindustan Copper*
Time Frame: Daily
Observation:
* Rounding Bottom Formation
* Mean (EMA) Diversion on Daily time frame
Resistance/Target: 134 155 175 187
Support: 108 102

Hindcopper boHindcopper in channel
volume profile analysis expecting breakout
our trading system generate buy btst buy signal we grabbed 2% Loots
now price actions and volumes seems good to go ling
All levels shared for educational purpose only.We are not sebi registered

HIND COPPER Channel breakout HINDCOPPER is in near channel breakout . Draw at your chart and wait for the breakout by a daily Candle closing ( strong)

HINDCOPPER Positional entry levelNSE:HINDCOPPER is trading at best risk and reward level.
Best level to take positional entry is 102.50, will hold for the targets of 107 & 113.50.
My stop loss will 98 only.
Note: This is my personal analysis, only for learning.
Thanks.

HINDCOPPER break it's 200 EMA and resistance HINDCOPPER break it's 200 EMA and resistance with good volume spike if you want to take this trade, then the entry at 114 Stoploss at 107.8 and target at 126

[POSITIONAL] HINDCOPPER LONG BETrisk: Reward ratio is 1: 2
Rest as per Charts
********
Note -
One of the best forms of Price Action is to not try to predict at all. Instead of that, ACT on the price. So, this chart tells “where” to act in “what direction. Unless it triggers, like, let’s say the candle doesn’t break the level which says “Buy/Sell if it breaks”, You should not buy/sell at all.
=======
I use shorthands for my trades.
“Positional” - means You can carry these positions and I do not see sharp volatility ahead.
“Intraday” -means You must close this position at any cost by the end of the day.
=======
Always follow a stop loss.
In the case of Intraday trades, it is mostly the “Low/High of the Candle”.
In the case of Positional trades, it is mostly the previous swings
********


[POSITONAL] HINDCOPPER LONG BET risk: Reward ratio is 1: 2
Rest as per Charts
********
Note -
One of the best forms of Price Action is to not try to predict at all. Instead of that, ACT on the price. So, this chart tells “where” to act in “what direction. Unless it triggers, like, let’s say the candle doesn’t break the level which says “Buy/Sell if it breaks”, You should not buy/sell at all.
=======
I use shorthands for my trades.
“Positional” - means You can carry these positions and I do not see sharp volatility ahead.
“Intraday” -means You must close this position at any cost by the end of the day.
=======
Always follow a stop loss.
In the case of Intraday trades, it is mostly the “Low/High of the Candle”.
In the case of Positional trades, it is mostly the previous swings
********

Breakout of flag pattern... expected Hindustan Copper has form classic flag pattern and about to break the pattern. If it break above 119 levels above the flag than it may touch 280 in next 2-3 year....means almost double the money
