HINDUNILVR | Buy @LTP | SL below 2385 | Target 2755Disclaimer:
This is not financial advice. Please do your own research or consult with a financial advisor before making any investment decisions. Investments in stocks can be risky and may result in loss of capital.
HINDUNILVR trade ideas

Hindustan Unilever looks strong. Hindustan Unilever Ltd. engages in the manufacture of consumer goods. It operates through the following segments: Home Care, Beauty and Personal Care, Foods and Refreshments, and Others. It is one of leading company in FMCG sector.
Hindustan Unilever Closing price is 2453.60. Dividend Yield @CMP = 1.78%. The positive aspects of the company are Stocks Outperforming their Industry Price Change in the Quarter, Companies with Zero Promoter Pledge, Company able to generate Net Cash - Improving Net Cash Flow for last 2 years, FII / FPI or Institutions increasing their shareholding and MFs increased their shareholding last quarter. The Negative aspects of the company are high Valuation (P.E. = 53.9), Increasing Trend in Non-Core Income, Declining Revenue every quarter for the past 2 quarters and PEG greater than Industry PEG.
Entry can be taken after closing above 2460 Historical Resistance in the stock will be 2498 and 2534. PEAK Historic Resistance in the stock will be 2571 and 2601. Stop loss in the stock should be maintained at Closing below 2391 or 2369 depending upon your risk taking ability.
Disclaimer: The above information is provided for educational purpose, analysis and paper trading only. Please don't treat this as a buy or sell recommendation for the stock or index. The Techno-Funda analysis is based on data that is more than 3 months old. Supports and Resistances are determined by historic past peaks and Valley in the chart. Many other indicators and patterns like EMA, RSI, MACD, Volumes, Fibonacci, parallel channel etc. use historic data which is 3 months or older cyclical points. There is no guarantee they will work in future as markets are highly volatile and swings in prices are also due to macro and micro factors based on actions taken by the company as well as region and global events. Equity investment is subject to risks. I or my clients or family members might have positions in the stocks that we mention in our educational posts. We will not be responsible for any Profit or loss that may occur due to any financial decision taken based on any data provided in this message. Do consult your investment advisor before taking any financial decisions. Stop losses should be an important part of any investment in equity.

HINDUSTAN UNILEVERHindustan Unilever Ltd. is India’s leading fast-moving consumer goods (FMCG) company, with a portfolio spanning personal care, home care, foods, and beverages. Backed by strong brand equity, extensive distribution, and consistent innovation, the company maintains dominant market share across categories like soaps, shampoos, detergents, tea, and ice creams. The stock is currently trading at ₹2441.
Hindustan Unilever Ltd. – FY22–FY25 Snapshot
Sales – ₹52,446 Cr → ₹56,370 Cr → ₹59,625 Cr → ₹63,180 Cr – Steady topline growth driven by volume and premiumization
Net Profit – ₹9,846 Cr → ₹10,340 Cr → ₹10,790 Cr → ₹11,270 Cr – Margins stable across business lines with cost leverage
Order Book – Moderate → Moderate → Strong → Strong – Strong urban retail and rural penetration continuing Dividend Yield (%) – 1.43% → 1.48% → 1.52% → 1.57% – Consistent payouts reflecting robust free cash flows Operating Performance – Strong → Strong → Strong → Strong – Operational discipline and category leadership Equity Capital – ₹234.96 Cr (constant) – No dilution Total Debt – ₹0 Cr (debt-free) – Fully equity-funded operations
Total Liabilities – ₹12,740 Cr → ₹13,180 Cr → ₹13,560 Cr → ₹13,970 Cr – Stable and aligned with scale
Fixed Assets – ₹3,985 Cr → ₹4,100 Cr → ₹4,240 Cr → ₹4,390 Cr – Modest capex focused on automation and digitization
Latest Highlights FY25 net profit rose 4.4% YoY to ₹11,270 Cr; revenue grew 5.9% to ₹63,180 Cr EPS: ₹48.00 | EBITDA Margin: 24.2% | Net Margin: 17.83% Return on Equity: 22.44% | Return on Assets: 17.15% Promoter holding: 61.90% | Dividend Yield: 1.57% Premium personal care and food innovations led category outperformance Expansion in digital-first channels and rural activation remained strong
Institutional Interest & Ownership Trends Promoter holding stands high at 61.90%, with no pledging or dilution. FIIs and DIIs maintain steady positions given HUL’s status as a portfolio staple. Mutual fund holdings are concentrated in consumption and defensives, and delivery data reflects sustained long-term holding.
Business Growth Verdict Yes, Hindustan Unilever continues to demonstrate category leadership and resilience Margins and cash flows are consistently strong with minimal volatility Debt-free operations underscore financial strength Capex remains targeted, driving process and product innovation
Company Guidance Management expects low-to-mid single-digit revenue growth in FY26, led by continued premiumization, cost optimization, and digital outreach initiatives.
Final Investment Verdict Hindustan Unilever Ltd. remains one of India’s most durable compounders in the FMCG sector. With iconic brands, robust financials, and operational excellence, the company continues to deliver steady returns for long-term investors. Its balance sheet strength, innovation-led strategy, and defensive positioning make it ideal for sustained accumulation in consumption-focused portfolios.

Hindustan Unilever Long TargetHindustan Unilever has broke its resistance at 2440 and blasted 90 points. If it sustains 2500 levels then chances of it reach 2600 is pretty high.
So, if it sustains 2500 and close above 2500 then go long.
Target - 2600
SL - 2490

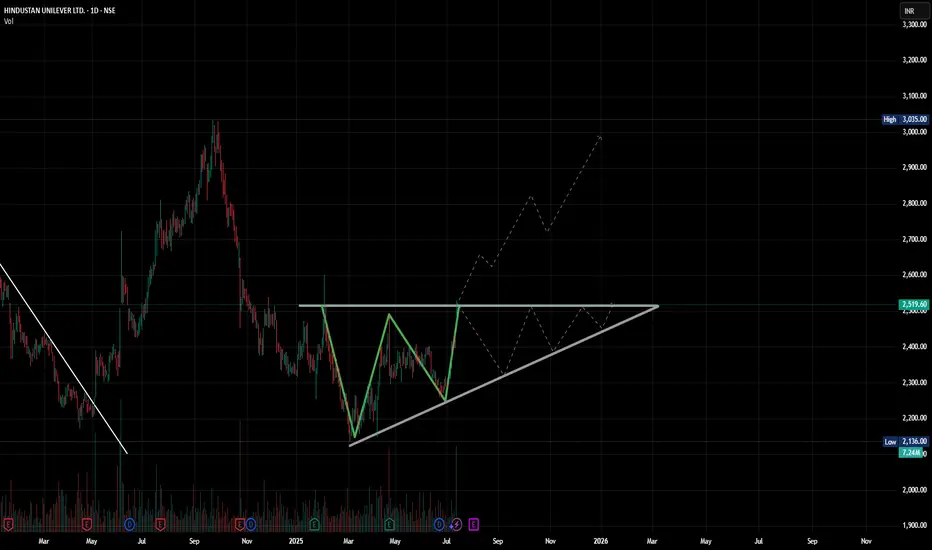
W For Win? HUL Pulls Up with a Perfect Double BottomPrice showing up to resistance like it forgot the last time it got slapped here. But this time it brought volume. Respect?
(Or the probable ascending triangle.. u know?)
HINDUSTAN UNILEVER BUYING ABOVE 2532..Hindustan Unilever has changed character from bearish to bullish and now in a good range.
any move above 2532 will lead to a good upside move.
let's c how it works.

Hindustan Unilever Ltd. – Bullish Breakout with Strong MomentumHindustan Unilever opened the session with a gap-up accompanied by above-average volume, signaling strong buying interest right from the start. While the stock saw some early profit-booking, it quickly regained momentum and is currently trading near the day’s high—an encouraging sign of sustained demand.
Weekly Chart: The formation of a large bullish candle this week suggests aggressive buying and a potential shift in sentiment. This pattern indicates that the bullish momentum is likely to continue into the coming week.
Daily Chart: The stock has successfully broken out above multiple resistance levels, confirming a bullish breakout structure. The breakout is backed by volume, adding credibility to the move.
Trading Strategy:
Given the alignment of bullish signals on both the daily and weekly timeframes, a swing long position is warranted for the upcoming week. Traders may consider the following approach:
Entry: On a minor intraday pullback or a break above the current day’s high for confirmation
Stop-loss: Below the breakout level or this week’s low
Target: Next key resistance or a measured move based on the breakout range , approximately 10% from current levels
The technical setup reflects strong bullish momentum and suggests further upside potential in the near term.

HULWaiting for green candle with big volume in daily time frame it may be gud trade from because support became resistance. Entry and SL will be updated later.

Hindustan Unilever This stock is trading near 200 Day(Ema&Dma) with horizontal support in a weekly timeframe and expect a good reversal.

HUL Buying opportunityHUL Buying opportunity in daily timeframe forming a bullish pattern in this market uncertainty FMCG could be the best choice to stay safe and make better returns.

on weekly base is down trend but there is a chance big points big different of points you can enter in this trend untill the price hit to upper trend line and take points and exit the trade this idea is only for education purpose take the action on your own risk


HINDUSTAN UNIL. Long term safe bet for investmentHUL: being a blue chip in the safest sector for FMCG in this extremely volatile market.
Add in this every fall in small quantity to reach 300 quantity so that this position can be used to hedge against CE sell or creating hedge position by sellign Fut lot, or buyin a PE.
But as HUL is a blue chip and has good growth expected in the coming years so this can be a safe bet.
This will have a good rally above 2500 and then above 2700
acc. till 2100-2400, good support at 2100 below 211
Disclaimer: only for educational purposes. not a buy-sell rec.

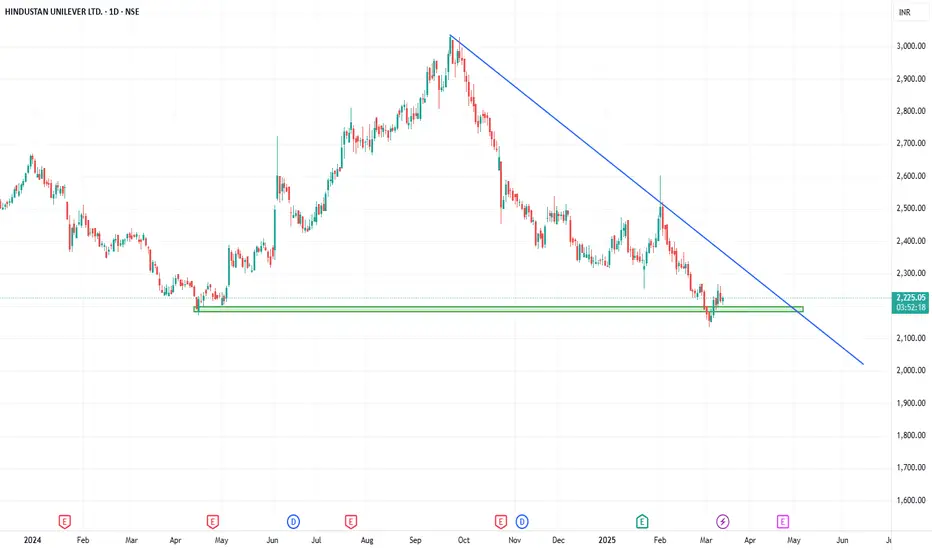
HindustanUnilver 2375 - Will history repeatHUL 2375 has given breakout from round bottom pattern but resisted by long trend resistance line. Though pattern was similar to that of last year breakout, it seems to fail this time as the last year breakout was clearly above the resistance line.
We expect history will not repeat this time and HUL will drop to 2271 before further breakdown to 1600.

Hindustan Unilever (HUL) – Prime Setup for BTST & Investment!Description:
🔎 Market Overview & Technical Structure
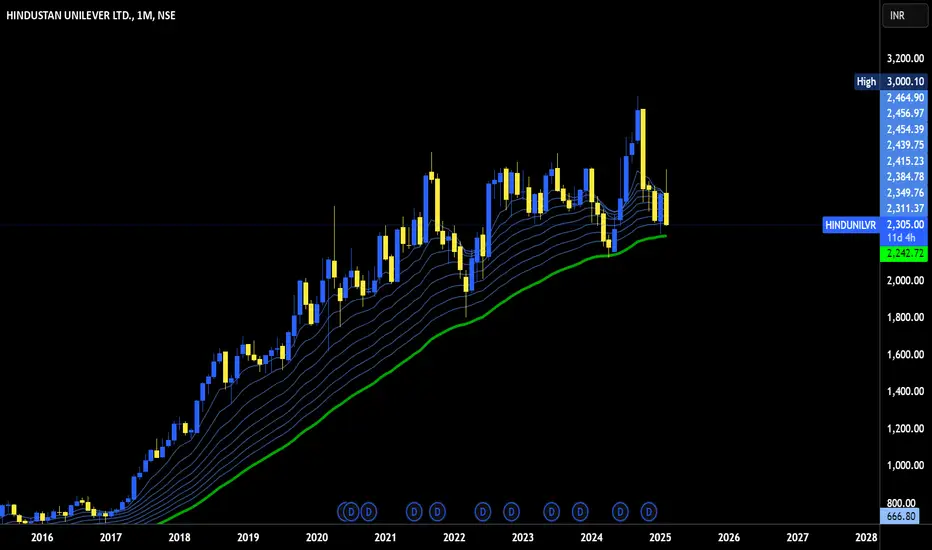
Hindustan Unilever (HUL) is showing a strong technical setup for both short-term (BTST) and long-term investment opportunities. After a prolonged 2-year consolidation phase, the stock has finally broken out of its previous high from September 2021, indicating the potential for a strong upward move.
📉 Stock Correction from High:
All-Time High: ₹2,859 (September 2021)
Recent Low: ₹2,136 (September 2024)
Correction from High: ~30%
Current Price: ₹2,200 (Approx.)
💡 Why is This a Strong Investment Zone?
✅ Major 2-Year Consolidation Breakout – After a long consolidation period, stocks often witness strong movements.
✅ Previous Swing Low Taken – The stock has swiped the monthly swing low of ₹2,172.05 before rebounding, indicating potential accumulation.
✅ Higher Timeframe Confirmation – Strong price structure formation, confirming a bullish outlook.
✅ Low-Risk, High-Reward Setup – The entry provides a good risk-reward ratio, making it attractive for both traders and investors.
📌 Trading & Investment Plan:
🔹 📍Entry Strategy:
Conservative Approach: Wait for price to cross ₹2,200 for a confirmed breaks
Aggressive Approach: Enter at current levels but with a strict stop-loss.
🔹 🎯 Target Projections:
✅ Target 1: ₹2,368 (Short-term Target)
✅ Target 2: ₹2,604 (Medium-term Target)
✅ Target 3: ₹2,864++ (Long-term Potential)
🔹 📉 Stop Loss:
🔺 Strict Stop-Loss: ₹2,136 (Recent Low) – Keeps risk controlled in case of further downside.
🔹 Risk Management & Position Sizing:
Always allocate capital wisely based on risk tolerance.
Avoid over-leveraging and use stop-loss discipline to protect capital.
📢 Final Thoughts – Why This Trade Looks Promising?
📊 HUL has corrected ~30% from its all-time high and is showing strong accumulation signs.
📊 After swiping key swing lows, the stock is indicating a bullish reversal.
📊 A clean breakout could take the stock to new highs in the coming months!
🚀 Don’t Miss Out!
✅ Follow me for more expert stock insights!
👍 Like & comment if you found this analysis helpful!
💬 Let’s discuss in the comments – See you there! 📈

Double bottom?I see what looks like here a double bottom in Hindustan Unilever and and wedge at the same time!

HUL at Strong Support Zone – Reversal Ahead?Hindustan Unilever Ltd (HUL) is currently trading near a key support level, indicating a potential reversal zone. Watch for price action signals like bullish candles or volume spikes to confirm a bounce. If the support holds, an upward move could follow; if broken, further downside may be seen. Keep an eye on RSI and MACD for additional confirmation. Ideal spot for swing traders and positional entries with proper risk management.
#HUL #HindustanUnilever #SupportLevel #TechnicalAnalysis #SwingTrade #NSEStocks #StockMarketIndia #PriceAction #ReversalZone #TradingViewIdeas
Bullish View on HUL Hindustan Unilever Limited (HUL) is one of India’s leading fast-moving consumer goods (FMCG) companies, headquartered in Mumbai. A subsidiary of the British-Dutch multinational Unilever, HUL has a rich legacy spanning over 90 years in India. The company operates in multiple categories, including personal care, home care, foods, and beverages, with well-known brands like Lux, Dove, Surf Excel, Vim, Brooke Bond, and Kwality Wall’s. HUL is known for its strong distribution network, reaching millions of consumers across urban and rural India. The company emphasizes sustainability and innovation, integrating eco-friendly practices in its operations. With a commitment to delivering high-quality products and enhancing consumer experiences, HUL continues to be a dominant force in India's FMCG sector.

Round Bottom in Hindustan UniliverHindustan Uniliver has made a rounding bottom. Breakout to top is not even close so we have to wait. You can keep this on your radar

hindustan uniliver bearish view till vvwapHindustan Unilever is in the FMCG business comprising primarily of Home Care, Beauty & Personal Care and Foods & Refreshment segments. The Company has manufacturing facilities across the country and sells primarily in India.
Key Points
Business Segments & Brand Portfolio
The company has a portfolio of over 50 brands, spanning 16 FMCG categories, including 19 brands with a turnover of more than Rs. 1,000 Cr PA. The products are split into the following segments:
1) Home Care (36% in H1 FY25 vs 32% in FY22): The company offers detergent bars, detergent powders, detergent liquids, scourers, purifiers, etc under its brands such as Surf excel, Wheel, Rin, Comfort, Vim, and Domex. The segment revenue grew by 32% between FY22 and FY24, driven by volume growth in the Fabric and Household Care business with a negative price growth.
2) Beauty & Personal Care (36% in H1 FY25 vs 37% in FY22): The company offers products in the categories of oral care, skin care, soaps, hair care, deodorants, talcum powder, color cosmetics, salon services, etc under the brands like Sunsilk, Vaseline, Glow & Lovely, Lakme, Lifebuoy, Ponds, Dove, Closeup, and more. The segment revenue grew by 15% between FY22 and FY24, driven by volume growth.
3) Foods and Refreshments (14% in H1 FY25 vs 27% in FY22): The company offers culinary products like tomato-based products, fruit-based products, soups, etc, tea, coffee, nutrition drinks, ice-cream, and frozen desserts, through brands like Brooke Bond, Lipton, Horlicks, Boost, Bru, Kissan, Knorr, Hellmann’s, Kwality Walls and Magnum. The segment revenue grew by 8% between FY22 and FY24, with a Mid-single-digit volume growth driven by pricing.
4) Other (3% in Q1 FY25 vs 4% in FY22): The segment includes exports, consignment etc. It aims to export brands, such as Vaseline, Dove, Pears, Bru, Red Label, Lakmē, Horlicks, and Boost, to effectively provide cross-border sourcing of FMCG products to other Unilever companies worldwide.
Market Leader
The company’s brands hold the top 2 spots in most categories where it has a presence. It has a stable brand power in 75% of its businesses.
New Product Launches
In FY24, the company launched various new products including a range of Lakme cosmetics, sun-care products under Glow and Lovely, Ponds and Lakme skin, and a sensitive skin cleansing range by Dove. In the Ice Cream portfolio, it launched Feast Crackle, under the partnership with Cadbury. It launched a range of flavored coffee under Bru Gold. Similarly, Knorr launched Korean noodles in new flavors like Kimchi and Jjajangmyeon. It has expanded its premium portfolio with these launches and re-launched other existing products in premium formats, which contributed to 25% of the total revenue in FY24.
Distribution Network
The company has a presence in 9 out of 10 Indian with over 9 million retail outlets spread across India through a network of 35 distribution hubs and more than 3,500 distributors.
Manufacturing Capabilities
The company has over 28 owned factories in India and over 50 manufacturing partners, that produce over 75 billion units annually. It manufactures over 250 SKUs at its nano-factories. Its Dapada and Sonepat factories have the title of ‘End-to-End Lighthouse’, awarded by the World Economic Forum for implementing advanced fourth industrial revolution solutions.
R&D
The company has 6 global R&D centers in 5 countries with over 5,000 professionals, including 3 centers in India, with over 20,000 patents, patent applications, and deep science and technology expertise in emerging areas such as Renewable Consumers Ingredients, Next Generation Biology, and Positive Nutrition.
Divestment
In July 2024, the company approved the sale of its's Water Purification business carried under the brand 'Pureit', to A. O. Smith India Water Products Private Limited, for Rs. 601 Cr.
Focus
The company is focused on driving competitive volume-led growth and actions to improve skin cleansing business performance. It expects the EBITDA margin to remain at current levels of 23-24%.

Hindustan Unilever at its Monthly SupportHindustan Unilever at its Monthly Support
As the Central Government budgetary allocation changes its focus from Infra to Consumption story and middle class seems to be the biggest beneficiary as the leader of the FMCG Sector.
Do your own analysis as well

HUL LOOKS Bullish From HereAbout
Hindustan Unilever is in the FMCG business comprising primarily of Home Care, Beauty & Personal Care and Foods & Refreshment segments. The Company has manufacturing facilities across the country and sells primarily in India.
Key Points
Business Segments & Brand Portfolio
The company has a portfolio of over 50 brands, spanning 16 FMCG categories, including 19 brands with a turnover of more than Rs. 1,000 Cr PA. The products are split into the following segments:
1) Home Care (36% in H1 FY25 vs 32% in FY22): The company offers detergent bars, detergent powders, detergent liquids, scourers, purifiers, etc under its brands such as Surf excel, Wheel, Rin, Comfort, Vim, and Domex. The segment revenue grew by 32% between FY22 and FY24, driven by volume growth in the Fabric and Household Care business with a negative price growth.
2) Beauty & Personal Care (36% in H1 FY25 vs 37% in FY22): The company offers products in the categories of oral care, skin care, soaps, hair care, deodorants, talcum powder, color cosmetics, salon services, etc under the brands like Sunsilk, Vaseline, Glow & Lovely, Lakme, Lifebuoy, Ponds, Dove, Closeup, and more. The segment revenue grew by 15% between FY22 and FY24, driven by volume growth.
3) Foods and Refreshments (14% in H1 FY25 vs 27% in FY22): The company offers culinary products like tomato-based products, fruit-based products, soups, etc, tea, coffee, nutrition drinks, ice-cream, and frozen desserts, through brands like Brooke Bond, Lipton, Horlicks, Boost, Bru, Kissan, Knorr, Hellmann’s, Kwality Walls and Magnum. The segment revenue grew by 8% between FY22 and FY24, with a Mid-single-digit volume growth driven by pricing.
4) Other (3% in Q1 FY25 vs 4% in FY22): The segment includes exports, consignment etc. It aims to export brands, such as Vaseline, Dove, Pears, Bru, Red Label, Lakmē, Horlicks, and Boost, to effectively provide cross-border sourcing of FMCG products to other Unilever companies worldwide.
Market Leader
The company’s brands hold the top 2 spots in most categories where it has a presence. It has a stable brand power in 75% of its businesses.
New Product Launches
In FY24, the company launched various new products including a range of Lakme cosmetics, sun-care products under Glow and Lovely, Ponds and Lakme skin, and a sensitive skin cleansing range by Dove. In the Ice Cream portfolio, it launched Feast Crackle, under the partnership with Cadbury. It launched a range of flavored coffee under Bru Gold. Similarly, Knorr launched Korean noodles in new flavors like Kimchi and Jjajangmyeon. It has expanded its premium portfolio with these launches and re-launched other existing products in premium formats, which contributed to 25% of the total revenue in FY24.
Distribution Network
The company has a presence in 9 out of 10 Indian with over 9 million retail outlets spread across India through a network of 35 distribution hubs and more than 3,500 distributors.
Manufacturing Capabilities
The company has over 28 owned factories in India and over 50 manufacturing partners, that produce over 75 billion units annually. It manufactures over 250 SKUs at its nano-factories. Its Dapada and Sonepat factories have the title of ‘End-to-End Lighthouse’, awarded by the World Economic Forum for implementing advanced fourth industrial revolution solutions.
R&D
The company has 6 global R&D centers in 5 countries with over 5,000 professionals, including 3 centers in India, with over 20,000 patents, patent applications, and deep science and technology expertise in emerging areas such as Renewable Consumers Ingredients, Next Generation Biology, and Positive Nutrition.
Divestment
In July 2024, the company approved the sale of its's Water Purification business carried under the brand 'Pureit', to A. O. Smith India Water Products Private Limited, for Rs. 601 Cr.
Focus
The company is focused on driving competitive volume-led growth and actions to improve skin cleansing business performance. It expects the EBITDA margin to remain at current levels of 23-24%.
PREPARE FOR HINDUNILVR CRASHHINDUNILVR is showing a dangerous price action on the Weekly charts.
If my analysis is right, then the Bears have totally taken over control and we can anticipate the stock to have a major correction this year.
Those who are holding long positions on this stock for investment may relook into it.
I foresee the correction to head towards 1650 price levels.
Certainly bad news for the holders.
