HUL's love hate relationship with oilHUL maintains rally with oil prices, but only to a limit, after which its pricing power and brand power in terms of passing on costs crashes.
However, historically it has always recovered from super lows. At 1866 is a super buying opportunity. Buy 10% at current levels, and keep buying in tranches till the bottom out at 1866.
Set your GTTs for a upside recovery of 20%
HINDUNILVR trade ideas

HUL buy for intraday tradingHUL buy for intraday trading if stock and FMCG sector also bullish.........

Hindustan unilever buy for intraday tradingHindustan unilever buy for intraday trading if stock and FMCG sector also strong......


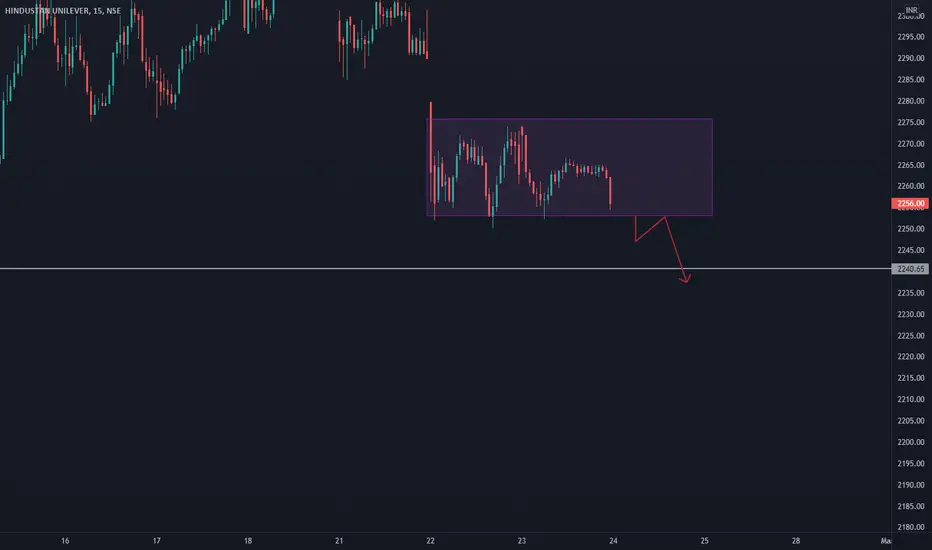
Delivery - BUY @ 2157 - TGT 2225BUY @ 2157
TGT -2225
Sl - 2115
Hit the bottom channel and reversing.
3 days trade

HINDUSTANUNILEVER SELL for intraday tradingHINDUSTANUNILEVER SELL for intraday trading if stock and FMCG Sector also weak......
Hindustan Unilever This stock has formed Decending Triangle pattern and given Breakout with good intensity of volume. One can go Long at current levels or in dips (if any) with Stop-loss of 2200 for targets upto 2570.
Breakout with good intensity of volume
All the key levels are mentioned in chart
Macd in hourly positive
Macd in daily positive crossover
Rsi in hourly above 60 and uptick
Disclaimer
I am not sebi registered analyst
My studies are Educational purpose only
Please consult your Financial advisor before trading or investing

Hindustan Unilever HUL broke last week's high of 2316.70 & trading well above it.
Could be bought with mentioned stoploss & targets.

Hindustan unilever buy for intraday tradingHindustan unilever buy for intraday trading if stock and FMCG also strong..........

My Intraday StrategyMy Intraday Strategy:
If Price Break 2267.09 Price, I'll buy on 09/02/2022. What will you do? Let me know in comment section.


HUL for Aditya sirThe Hul is going to DUmp, as 5th wave completed, this seems to be the first wave .

HINDUSTAN UNILEVER BUYHINDUSTAN UNILEVER BUY for day trading if stock break the resistence zone.........

HINDUSTAN UNILEVER SELLHINDUSTAN UNILEVER SELL for day trading if FMCG sector also weak..............

HINDUSTANUNILEVER BUYHINDUSTANUNILEVER BUY for day trading if stock and FMCG also strong .............

Hindalco chart🥳Hindalco making a beautiful symmetrical triangle pattern and given a partial breakout towards downside
May give a downside movement soon
Like, comment, follow share💕
*Price action strategy*

HUL SWING TRADE.NOT AN FINACIAL ADIVCE.HUL TECHNICAL ANALYSIS
TARGET-2440,2580,2700
Hindustan Unilever Limited is a consumer goods company headquartered in Mumbai, India. It is a subsidiary of Unilever, a British company. Its products include foods, beverages, cleaning agents, personal care products, water purifiers and other fast-moving consumer goods

Hindustan unilver at daily time frame demand zone with RSI indiHindustan unilver
at demand zone with
Postive RSI divergance
Good time to go long for long term invstrs

HUL Hindustan Unilver IndiaYou really want to leave free money?? some of the famous brands--
so whenever you buy these products, you are helping the company grow!!
www.hul.co.in
SOAPS---
Dove, Lux, Lifebuoy, Pears, Hamam, Lyril, Rexona,
DETERGENT
Surf Excel, Wheel, Comfort
SHAMPOO / SKIN CARE
Clinic Plus, Sunsilk, Fair & Lovely, Pond's, Lakmè, Vaseline,
BEVERAGE/ TEA
Bru, Taj Mahal, Lipton, Brooke Bond,
TOOTHPASTE
Close up, Pepsodent
MISC
Cornetto Icecream
Kisan ketchup,
Annapurna atta,
Magnum icream

Bullish on HINDUSTAN UNILEVER2317 - 2345 is a very strong zone for HUL. Its a very big support zone since a year, If HUL breaks this zone then the next resistance comes up at 2508 - 2520.

HINDUNILVR ANALYSISCup and Handle Pattern(Bullish)
CMP: 2325.50
Resistance Zone: 2325-2330
Upside Target: 2364-2369
SL below 2300

HINDUNILVR#HINDUNILVR
Price taking support near the multi year trendline.
Bullish Engulfing candle today (21-Jan), with decent volume as well.
long as far this trendline is respected.
