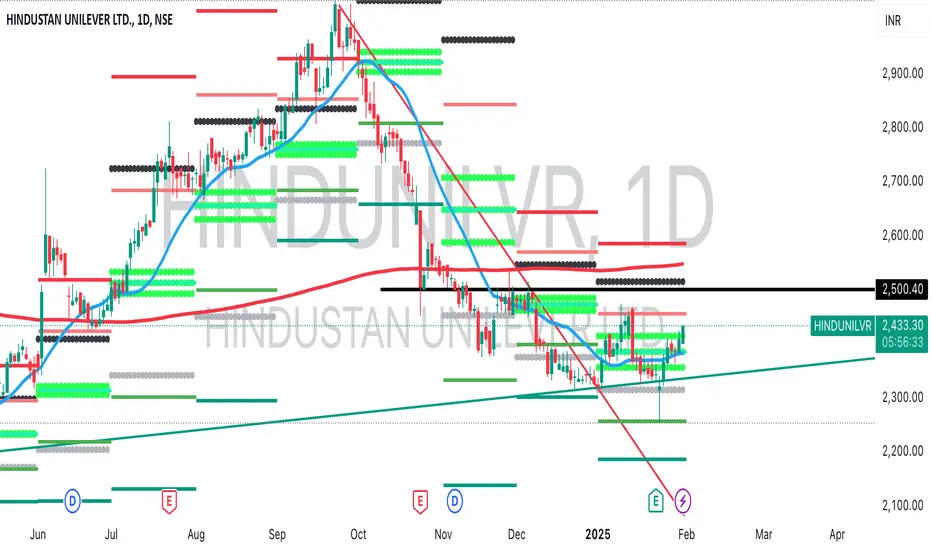
HINDUNILVR | LONG REVERSAL | DAILY CHARTPrice action on the Daily charts confirms Bullish sentiment on HINDUNILVR.
Notice how the price is holding the 20 MA and also the Monthly CPR.
This is a clear confirmation of a reversal from the lows.
First Long Target - 2550.
HINDUNILVR trade ideas
Hindustan Unilever at Monthly SupportHUL - a leader in FMCG Business is at its Monthly Support Zone.
May recover from here.
Do your own diligence.

HULHUL weekly chart show are still in higher time frame wave 4 consolidation, and we might have done with wave A of the last leg to raise on B and then fall on C to finally complete the corrective phase on the stock, The chart only shows probability of wave patterns and does not guarantee movement on this pattern as this depends on herd psychology and its behavior. always protecting capital is the first target for any trader to be successful

HINDUNILVR NSE:HINDUNILVR
FMCG Sector stock.
Leaders in this sector.
Corrected 24% from top.
Pivot S2- 2185
pivot- 2385
RSI 38 oversold zone
last 2 days volume is increasing.
Made doji sign of reversal
Good for long term.
Good above 2340
sl- 2172 for long term on CLBS
Target- 2600+ or trail your SL.

HINDUNILVR | SHORT | SWINGHINDUNILVR is showing further signs of weakness and has rejected the Monthly Pivot and the Weekly Pivots this week.
Those looking for an STBT type set up can short it and exit around 2312 levels.
Those looking to hold on Swing basis can look for target till 2256 price levels.

HINDUNILVR | LONG | BTSTLike it's FMCG counterpart BRITANNIA, UNILEVER too is exhibiting Bullish tendencies today morning and it looks like this counter is going to remain Bullish this week.
It has broken out from the Weekly Pivot on the upside and could test 2489 price levels by tomorrow.

Long in HINDUNILVR HINDUNILVR is on the 200EMA support and it's a high possibility for 2550 first target.

HIND unilever - Entry Levels to go bullish The stock expected to get rejected from the levels of 2294 and from the levels of 2200.
The price can fly to the levels of 2670 and 2500 as a minimum.


Hindunilvr Short 1 Hr time frame analysisMarket has bearish sentiment there is possibility of market to continue selling, And as per Wyckoff theory there is possibility of sell side

HUL LONGHUL
MTF Analysis
HULYearly Demand 2190
HUL 6 Month Demand 2425
HULQtrly Demand BUFL 2413
HULMonthly Demand 2298
HULWeekly Demand 2217
HULDaily Demand DMIP 2249
ENTRY -1 Long 2298
SL 2170
RISK 128
Target as per Entry 2900
RR 5
Positional Target 3958
Target Points 602
Recent High 3,000
Recent Low 2,170

Hindustan Unilever: Big Move Incoming!Hindustan Unilever is at a tipping point, with the chart showing signs of a potential **major move**. The question is: **which side are we headed—UP or DOWN?**
🔍 **What’s the Buzz?**
- Price is consolidating tightly, building energy for a breakout.
- Momentum indicators are signaling a decisive shift is near.
- Key support and resistance levels are acting like a pressure cooker—**a move is inevitable!**
💡 **Your Call:**
Will Hindustan Unilever rally to new highs, or are we looking at a breakdown? Cast your vote—**UP or DOWN?** Let’s see where the market takes us! 🚀👇

HUL PRICE ACTIONHUL price action suggesting a long near the cmp, we can witness a price rise of 50-150 in near short term...!

HINDUNILVR : ready to spice up! Hindustan Unilever Ltd (HINDUNILVR)
Technical Analysis
The chart indicates a complex correction with potential wave reversal and long-term upside targets .
Golden Retracement Zone: ₹2,361–₹2,390
This zone aligns with Fibonacci levels and acts as a high-probability buying area .
Deep Retracement Zone: ₹2,263–₹2,348
A last line of defense for bulls, providing better entry opportunities if prices dip further.
Options/Future Target Levels: ₹2,564–₹2,594
Initial resistance zone after a reversal.
First Target Level: ₹2,885
A mid-term target where partial profits can be booked.
Second Target Zone: ₹3,123–₹3,223
A long-term target for swing or positional traders.
Stop Loss: Below ₹2,263
If prices fall below this level, the setup is invalidated.
Educational Tips :
Buy Strategy:
Enter near ₹2,361–₹2,390 with confirmation signals (e.g., hammer or engulfing candles).
Add cautiously near ₹2,263–₹2,348.
Stop Loss: Below ₹2,263 to limit risk.
Target Levels:
Short-term: ₹2,564–₹2,594
Mid-term: ₹2,885
Long-term: ₹3,123–₹3,223
Conclusion and Key Tips :
Always wait for confirmation signals like bullish candles , breakouts , or trendline breaches before entering trades.
Use retracement zones ( golden and deep ) to time entries effectively.
Risk Management:
Place stop losses below critical support levels to limit potential losses.
Never risk more than 2–3% of your trading capital on a single trade.
Target Zones: Plan exits at resistance levels or predefined targets to secure profits.
These setups provide high-probability reversal opportunities with proper risk management and target planning.

HINDUSTAN UNILEVERSWING / POSITIONAL TRADE
HINDUSTAN UNILEVER
CMP - 2390
SL - 2290
TARGET 1 - 1:3 Risk Reward
TARGET 2 - ATH (3000)
Disclaimer: Not Financial Advice. Only for Educational Purposes
Invest at your own risk

HUL1. Support and Resistance Zones:
Resistance Levels:
₹3,035.80: Strong overhead resistance.
₹2,835.65 - ₹2,741.15: Intermediate resistance zones, where previous rallies have faced selling pressure.
Support Levels:
₹2,454.90 - ₹2,314.55: A crucial support zone where the stock is currently trading. This is a potential demand zone for buyers.
₹2,102.20: If the price breaks below the current support, this would be the next major level to watch for buying interest.
2. Moving Averages:
The chart includes multiple moving averages, indicating:
Short-term bearishness: Price is below key moving averages (e.g., 20-day, 50-day), signaling short-term weakness.
Medium-to-long-term potential support: Long-term moving averages align near significant support zones, reinforcing their importance.
3. MACD Indicator Analysis:
Current Status:
MACD Line (-41.89) is below the Signal Line (-43.83), indicating ongoing bearish momentum.
The histogram is negative but shows signs of narrowing, which might indicate that bearish momentum is losing strength.
Potential Reversal Signal:
A bullish crossover (MACD Line crossing above the Signal Line) near the current support zone could confirm a reversal in the near term.
4. Trend and Pattern Observations:
The stock appears to be consolidating within a range-bound structure between ₹2,100 and ₹3,000 over the past few years.
Bearish Momentum: The recent breakdown from the ₹2,700 level and continued lower highs indicate bearish dominance.
Key Pattern: There’s no visible breakout or breakdown from a larger pattern yet, but the current zone could define the stock's next move.
5. Buying Zones and Strategy:
₹2,454.90 - ₹2,314.55:
Look for reversal patterns (e.g., bullish candlesticks or a MACD crossover) to confirm buying opportunities.
Entry near the bottom of this range (closer to ₹2,314.55) may provide a favorable risk-reward setup.
₹2,102.20:
In case the price breaks below the current zone, this is the next significant demand level.
6. Volume Analysis:
The chart indicates recent volumes at 3.23M, suggesting active participation, but a lack of visible accumulation or distribution trends limits further insights.
Summary:
The stock is testing a critical support zone. Watch for reversal signals from indicators like MACD or price action confirmation.
A sustained move above ₹2,454.90 could indicate a recovery toward ₹2,700, while a breakdown below ₹2,314.55 might extend the decline to ₹2,102.20.

HINDUNILVR | Long | Swing HINDUNILVR has been forming a good base near the Monthly Pivot.
Bulls took the price up on 22nd Nov and formed a peak.
Now that level seems to be holding.
On an intraday basis, there is a strong bullish momentum being displayed.
Hence, I have taken a Long position for a Target till Previous Week High level ~ 2538.
I'm anticipating that this level will be tested.
SL is below today's Low.

HINDUSTAN UNILIVER SHORT TERM ANALYSIS Hindustan Unilever appears to be in a favorable position, with a chart indicating a potential upside in the short term. The stock has the potential to reach a target of 2640-2670 upon crossing and sustaining a level of 2490. However, the current view remains invalidated if it breaches 2340 on the downside

HINDUNILVR Trading Within Fresh Demand ZoneHINDUNILVR is currently trading at ₹2389.2, which places it slightly above its demand zone between ₹2387.45 and ₹2344.3, established on 4th June 2024. This fresh zone has not been tested yet, suggesting the possibility of renewed buying interest if the price dips back into this range. Investors may consider monitoring for support near this level, potentially signaling a bullish opportunity.

HUL S/RSupport and Resistance Levels:
Support Levels: These are price points (green line/shade) where a downward trend may be halted due to a concentration of buying interest. Imagine them as a safety net where buyers step in, preventing further decline.
Resistance Levels: Conversely, resistance levels (red line/shade) are where upward trends might stall due to increased selling interest. They act like a ceiling where sellers come in to push prices down.
Breakouts:
Bullish Breakout: When the price moves above resistance, it often indicates strong buying interest and the potential for a continued uptrend. Traders may view this as a signal to buy or hold.
Bearish Breakout: When the price falls below support, it can signal strong selling interest and the potential for a continued downtrend. Traders might see this as a cue to sell or avoid buying.
20 EMA (Exponential Moving Average):
Above 20 EMA(50 EMA): If the stock price is above the 20 EMA, it suggests a potential uptrend or bullish momentum.
Below 20 EMA: If the stock price is below the 20 EMA, it indicates a potential downtrend or bearish momentum.
Trendline: A trendline is a straight line drawn on a chart to represent the general direction of a data point set.
Uptrend Line: Drawn by connecting the lows in an upward trend. Indicates that the price is moving higher over time. Acts as a support level, where prices tend to bounce upward.
Downtrend Line: Drawn by connecting the highs in a downward trend. Indicates that the price is moving lower over time. It acts as a resistance level, where prices tend to drop.
RSI: RSI readings greater than the 70 level are overbought territory, and RSI readings lower than the 30 level are considered oversold territory.
Combining RSI with Support and Resistance:
Support Level: This is a price level where a stock tends to find buying interest, preventing it from falling further. If RSI is showing an oversold condition (below 30) and the price is near or at a strong support level, it could be a good buy signal.
Resistance Level: This is a price level where a stock tends to find selling interest, preventing it from rising further. If RSI is showing an overbought condition (above 70) and the price is near or at a strong resistance level, it could be a signal to sell or short the asset.

HINDUNILVR Long OpportunityWe can go long from current level (2440 - 2500).This is strong institutional buying zone.
Best Opportunity For Short term investment.
Trade or Investment at your own risk.
i am not SEBI registered.

TredScanner - Stock Scanner for NSEThe market has been volatile since the morning, with FMI fluctuating and it finally stabilized & it signaled SHORT before 10:00 AM.
And we were ready! The top stocks in our FMI BREAKDOWN section were the result stocks i.e HINDUNILVR and LALPATHLAB, which both delivered strong down moves.
We saw the trend, We saw the stocks in front and acted on it. It simple with TREDSCANNER💸
With TredScanner, finding the right stocks becomes easier and faster

Hindustan unilever - double bottomHindustan unilever bouncing from double bottom level which confluence with Shark harmonic pattern.
Entry around 2700 SL if price closes below 2680 target 2770-2780.
