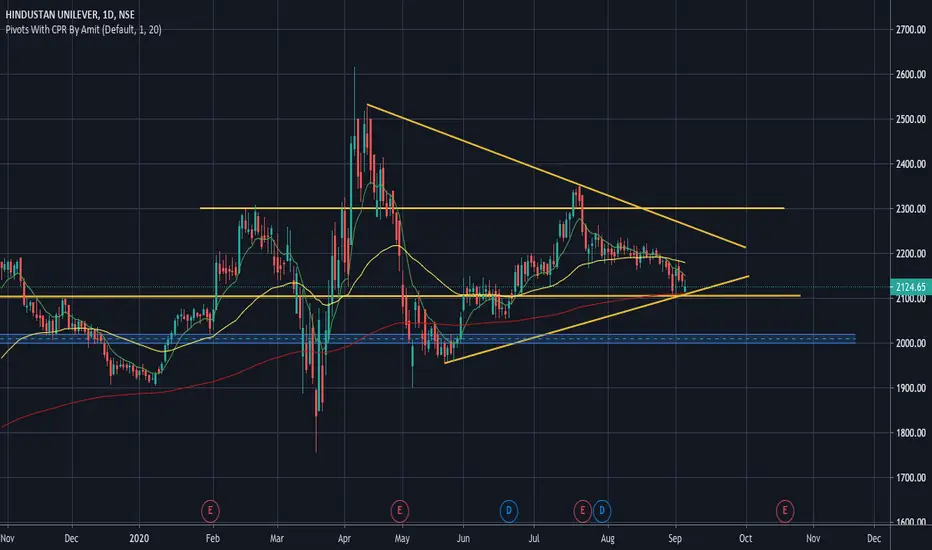
Is HUL gonna give next breakout? Here is the past trend and breakout of India's evergreen FMCG Hindustan Unilever. If we compare year on year financials it shows almost 15-20% growth in revenues as well in Net profits. But it's still hanging around below expected levels as compare to growth card and potential surge in market demands after pandemic.
Maybe it's time for banking and other industries. But it looks like by end of 3rd quarter HUL surely gonna cross resistance shown in chart.
HINDUNILVR trade ideas


Hindustan Unilever - makes higher low in uptrend Hindustan Unilever is making a higher high and higher low on the weekly chart. it is has made a higher low recently and ready for the upward journey.

Hindustan Unilever AnalysisHindustan Unilever Broke a Important trend and can reach till 2000 which will be a good opportunity to Buy


HUL very nice formation -CUP AND HANDLE and Support by GANNHUL after good results, looks to be forming a cup and handle at the trend line. Supported by GANN numbers look to be a buy at cmp as a bounce is expected.


HINDUNILVR LOOK OUT FOR THESE LEVELS!!! HINDUNILVR
CONDITION 1
Buy above 2129
IMPORTANT LEVEL: 2134 TO 2140
- If the price able to break this level with volume and convection add more quantity. Target: 2150/2160
- If the price is not able to break the level, you can sell the stock target 2120/2110
CONDITION 2
Sell below 2116
IMPORTANT LEVEL: 2110 TO 2100
- If the price able to break this level with volume and convection add more quantity. Target: 2089/2079
- If the price is not able to break the level, you can buy the stock target 2125/2135
If you like the analysis, do leave a like and follow for more such content.
The analysis is my POV, hope you got bucks in your pocket to consult a financial advisor before investing :P :)
PH No: 8433624173.
Don't entertain any FREE Advice/suggestions requests, so refrain from sending any such messages.
HAPPY TRADING

Go long if the resistance breaks on the closing basisHINDUNILVR Watchout on Black Line on Closing Basis for any opportunity to go long. Targets being the Red Trendline which is acting as a resistance if it breaks on a closing basis the Watch out for the green lines.
Reasons:
1. Resistance Zone Breakout
2. Fibo Supporting the move

Hul short candidate for mondayHul has again suffered resistance from 200 ma the fall is anticipatted if it trades below today's low on monday

hind unilever hul may go further from here. as my view it will go up to 2100/2143. follow the stop loss of 1997. for educational purpose only

HINDUNILVR - HINDUSTAN UNILEVERLET IT HOLD THE 2055 AND IF IT DOES THEN 2075 AND 2103 MAYBE
ELSE IT MIGHT BE DOWN TO 2020 AND 2002
************************************************************************************************************************************************
Hi all,
Its pleasure to have you all here.
I have started putting these charts as a contribution from my side to all people who are new to business, as I had to struggle a lot without any sources at disposal. So please consider this a just small contribution from my side.
Few Honest Disclosures:
1. Any idea shared is my personal view, its not a recommendation, neither any kind of paid propaganda, so please
do your bit of research.
2. Ideas shared does not mean that I trade all or have position in them, this is just a helping hand to all.
3. I expect no comments or like nor any negativity, as I said its just a small helping hand from my side, please plan your risk and trade as per your capacity.
4. To trade in Cash, options or futures is your sole choice and your own risk
5. I am no expert in Tech Indicators, I believe in support resistance and trendline theory, you may use this as a supplement theory for better results.
6. I work for my own living, this is a hobby which I do sincerely to help anyone who might come across my charts.
***********************************************************************************************************************************************


HUL (Reversal on the Cards ?)A continuation idea from last week. A beautiful triangle and a trend line being respected. 2100 is a crucial level which the stock held last week. So in the future any breach of 2100 might indicate a good short.
However on Friday HUL saw some good bullish momentum and also broke the trend line marked in blue however it could not close beyond it. It will be interesting to see whether the stock breaches it tomorrow and continues it journey upwards or reverses towards the lower line of the triangle.
The 2100 level is also supported by the 200EMA so any breach as mentioned which be a breach of an important area, a consolidation and a long term EMA indicating a bearish trend.
Keep an Eye it should be interesting.

HUL near trend line supportHUL may test TL at 2100 and bounce up 2180 and 2220
below 2100 can see panic till 1980 and 1800

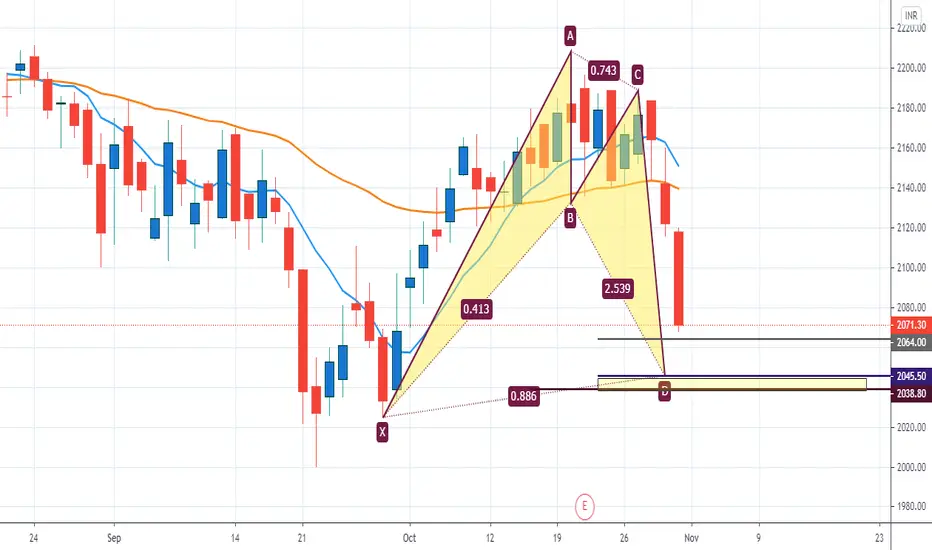
Hindustan Unilever (A Candidate for a Breakdown or a Reversal ?)HUL has been forming a triangle for quiet a while now. The markets have recently been looking weak and HUL currently is at a very crucial zone taking support at multiple support zones as well as on the 200 EMA. Any breakdown from these zones should ideally be followed with a strong price movement. The Risk Reward ratio looks pretty favourable with various EMA consolidating at a zone and there might also be a possibility of seeing a death cross in case the price moves further down.
With Nifty forming a Bearish Engulfing Pattern and the US markets witnessing a sell off, which side will you be looking for ?
Red Line- 200 EMA
Yellow Line- 50EMA
Green Line- 9EMA
HINDUSTAN UNILEVER - Long Term Holding NSE:HINDUNILVR
HINDUSTAN UNILEVER LCP 2170/-Rs
Pattern - Consolidation
Moving Average - Trading below 20/50 DMA
PE 74.10 Forward PE 60.24
Fair Value 1466.89/-Rs
Avg Brokers Target Price 2329/-Rs
Accumulate in Dips in Long Term View
Disclaimers: - The contents produced here are purely for Educational Purposes. They Should Not Be Constructed as Buy/Sell Recommendations
Financial Interest - Yes
