hindunilvr swing /postional
buy near 2735
avg at near 2700 -2685
sl 2650 3% sl
tgt 3%6%9%12%16%
hold 4-6 weeks
HINDUNILVR trade ideas

Hindustan Uniliver Next PossibilitiesLooks like it's bearish following the general market trend. It may rise again from the support

HUL S/R for 20/9/24Support and Resistance Levels:
Support Levels: These are price points (green line/shade) where a downward trend may be halted due to a concentration of buying interest. Imagine them as a safety net where buyers step in, preventing further decline.
Resistance Levels: Conversely, resistance levels (red line/shade) are where upward trends might stall due to increased selling interest. They act like a ceiling where sellers come in to push prices down.
Breakouts:
Bullish Breakout: When the price moves above resistance, it often indicates strong buying interest and the potential for a continued uptrend. Traders may view this as a signal to buy or hold.
Bearish Breakout: When the price falls below support, it can signal strong selling interest and the potential for a continued downtrend. Traders might see this as a cue to sell or avoid buying.
20 EMA (Exponential Moving Average):
Above 20 EMA: If the stock price is above the 20 EMA, it suggests a potential uptrend or bullish momentum.
Below 20 EMA: If the stock price is below the 20 EMA, it indicates a potential downtrend or bearish momentum.
Trendline: A trendline is a straight line drawn on a chart to represent the general direction of a data point set.
Uptrend Line: Drawn by connecting the lows in an upward trend. Indicates that the price is moving higher over time. Acts as a support level, where prices tend to bounce upward.
Downtrend Line: Drawn by connecting the highs in a downward trend. Indicates that the price is moving lower over time. It acts as a resistance level, where prices tend to drop.
RSI: RSI readings greater than the 70 level are overbought territory, and RSI readings lower than the 30 level are considered oversold territory.
Combining RSI with Support and Resistance:
Support Level: This is a price level where a stock tends to find buying interest, preventing it from falling further. If RSI is showing an oversold condition (below 30) and the price is near or at a strong support level, it could be a good buy signal.
Resistance Level: This is a price level where a stock tends to find selling interest, preventing it from rising further. If RSI is showing an overbought condition (above 70) and the price is near or at a strong resistance level, it could be a signal to sell or short the asset.
Disclaimer:
I am not a SEBI registered. The information provided here is for learning purposes only and should not be interpreted as financial advice. Consider the broader market context and consult with a qualified financial advisor before making investment decisions.

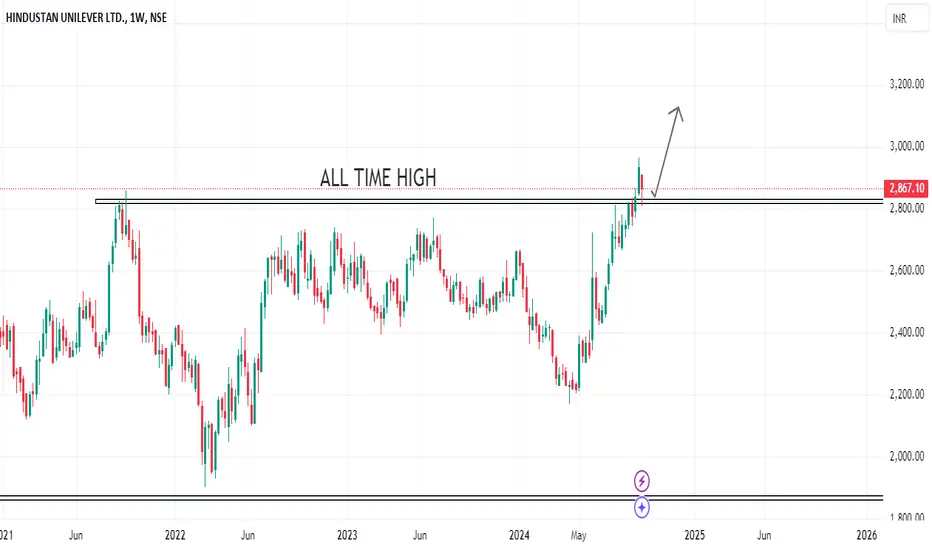
HINDUSTAN UNILEVER IS AIMING FOR A NEW ALL-TIME HIGH..! HINDUSTAN UNILEVER has reached a new all-time high and has successfully retested it. We can consider entering a buy position at this point.
Hindustan Unilever Ltd-Nice BreakoutHindustan Unilever Ltd-Nice Breakout
Capital to be deployed -20k
Investing Price-2880-2900
Breakout Price -2880
Stoploss -2733
Targets -3692
#StockMarketindia #StockToWatch #StocksInFocus #stockstowatch #StocksToTrade
#hul

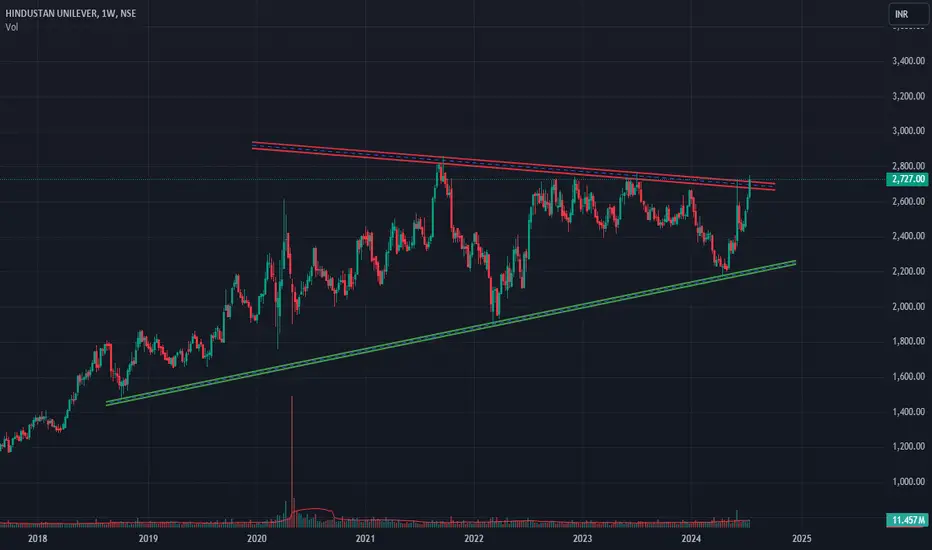
HINDUNIL Near Resistance – Watch for Breakout!➡️ Strong uptrend supported by ascending trendline
➡️ Resistance from Sep 2021 at ₹2,861
➡️ Wait for a close above resistance for a bullish breakout

Trying for ATH?Slowly going past all time high. Clear break out can take the price to 3000/-.
Upcoming +ves are companies say rural spends starting to raise slowly. Festive seasons.
Near term -ves are Fed rate cuts and profit booking.
I already invested from 2400 levels. Not taking any trade. Will add if price falls to 2400-2500 again. Only until fundamentals doesn't change.
Keep an eye on Adani Wilmar , Marico. Oil sales go up during festive season. Don't have to take trade in these. Observe the moment/trend then apply it in future.


HINDUNILVR chart analysis1. Multiyear breakout
2. If close above 2800 on monthly chart then a strong breakout possible.
Please share your valuable feedback.

Hindustan Unilever--- Can it be Next ITC..?? (Investment IDEA)Hindustan Unilever
Trading below 200 DMA.
Strong Fundamental
Stock PE is 58.2 (5 Year Median PE is 65.8)
Good Dividend Stock (About 50 rupees/Year)
Long Consolidation.

HUL may riseThere may be a rise in HUL. A good base is being seen in the stock, a rise of 5 to 10 percent can be seen in the coming sessions.

Hindustan Unilever Stock is hitting a marked zone from 2023. Generally if a price zone has been hit number of times then stock will breakout at some point. If this price zone is taken out then a very good risk to reward can be achieved.
Please check other price action parameters before entering. This is a long term call only after breakout.
This is for educational purpose.

HUL is the downtrend over?HUL has formed a nice Demand Zone on the daily time frame. Patiently waiting for price to pull back to this level

HUL, is it ready for trekking HUL, is it ready to trekking
Counts are suggesting what I am thinking about HUL.
I have charted out my view....
what is your's tell in comments
regards

Hindustan Unilever Ltd, Can the FMCG Giant Reach for 4700?Hindustan Unilever Ltd . (HUL), a household name in India, is the undisputed leader in the Fast-Moving Consumer Goods (FMCG) sector. But with ambitious targets like 4700 being thrown around, investors need a clear picture of the company's strengths, weaknesses, opportunities, and threats (SWOT) before making informed decisions.
STRENGTH
Brand Power: HUL boasts a powerful brand portfolio with over 40 iconic names like Lux, Dove, Lipton, and Lakmé. This brand loyalty translates to strong market share across various segments.
Distribution Network: HUL's extensive reach, spanning millions of outlets across India, ensures its products are readily available to consumers.
Innovation: HUL has a proven track record of innovation, constantly adapting its product offerings to cater to evolving consumer preferences.
Financial Performance: HUL maintains healthy financials with consistent profitability and strong return on equity (ROE) and return on capital employed (ROCE)
.
WEAKNESS
Commodity Price Dependence: HUL's reliance on raw materials like palm oil and crude oil makes it susceptible to price fluctuations.
Slow Growth: Recent years have seen a slowdown in revenue and profit growth, raising concerns about the company's ability to maintain its momentum.
Premium Pricing: HUL's products occupy the premium segment, which might limit its reach in a cost-conscious market.
OPPORTUNITIES
Rural Market Expansion: India's vast rural market presents a significant growth opportunity for HUL to tap into.
E-commerce Growth: The rise of e-commerce platforms creates new avenues for HUL to reach a wider online audience.
Premiumization: HUL can leverage its brand image to further premiumize its product offerings and cater to aspirational consumers.
THREATS
Competition: The FMCG sector is fiercely competitive, with both domestic and international players vying for market share.
Economic Slowdown: An economic slowdown could impact consumer spending, affecting HUL's sales.
Regulatory Changes: Regulatory changes in areas like packaging or taxation could disrupt HUL's operations and profitability.
Can HUL Reach 4700?
Reaching a target of 4700 will depend on HUL's ability to capitalize on its strengths and opportunities while mitigating its weaknesses and threats. Here are some key factors to consider:
Growth Strategy: HUL needs a clear strategy to reignite revenue and profit growth, potentially through rural market expansion, product innovation, or strategic acquisitions.
Commodity Price Management: Effective hedging strategies can help HUL navigate volatile raw material prices.
Competition: Staying ahead of the competition requires continuous innovation, efficient marketing, and a focus on building brand loyalty.
Investor Takeaway
Hindustan Unilever Ltd. remains a dominant player in the FMCG sector. However, achieving ambitious targets like 4700 requires a multi-pronged approach. Investors should carefully consider the company's SWOT analysis and future growth strategies before making investment decisions.
Disclaimer: This analysis is for informational purposes only and should not be considered investment advice. Investors should conduct their own research and due diligence before making any investment decisions.

HINDUNILVRStock name - Hindustan Unilever Limited.
Weekly chart setup
Chart is self explanatory. Levels of breakout, possible up-moves (where stock may find resistances) and support (close below which, setup will be invalidated) are clearly defined.
Master Score - C
Disclaimer: This is for demonstration and educational purpose only. this is not buying and selling recommendations. I am not SEBI registered. please consult your financial advisor before taking any trade.
HINDUSTAN UNILEVER : Updated Price ActionHere are some pointers to keep in mind:
- One year-long consolidation.
- Clearly defined support and resistance.
- 6 Week consolidation at the resistance zone makes the resistance weak
- Recent breakout was prevented with a long upper wick. A.K.A Sellers present.
- Margin of Safety is a mere 6% ( CMP vs ATH)
- There is no clear winner yet as the signals are mixed.
- A break of the consolidation range may lead to zone-to-zone momentum
What is your take on it? Feel free to comment. If it helped, Do Leave us a boost 🚀
Disclaimer: We are not registered advisors. The views expressed here are solely personal opinions. Irrespective of the language used, Nothing mentioned here should be considered as advice or recommendation. Please consult with your financial advisors before making any investment decisions. We like everybody else, have the right to be wrong :)

HINDUNILVR - Potential upside of 6% - RSI >30 and < 40HINDUNILVR's price bounced back near 2492. The RSI has reversed its direction and is currently below 40. If the price revisits the recent peak around 2726, it could potentially result in an approximate 6% increase.

HUL S/R for 18/7/24Support and Resistance Levels: In technical analysis, support and resistance levels are significant price levels where buying or selling interest tends to be strong. They are identified based on previous price levels where the price has shown a tendency to reverse or find support.
Support levels are represented by the green line and green shade, indicating areas where buying interest may emerge to prevent further price decline.
Resistance levels are represented by the red line and red shade, indicating areas where selling pressure may arise to prevent further price increases. Traders often consider these levels as potential buying or selling opportunities.
Breakouts: Breakouts occur when the price convincingly moves above a resistance level (red shade) or below a support level (green shade). A bullish breakout above resistance suggests the potential for further price increases, while a bearish breakout below support suggests the potential for further price declines. Traders pay attention to these breakout signals as they may indicate the start of a new trend or significant price movement.
20 EMA: The yellow line denotes 20 EMA, to interpret the 20 EMA, you need to compare it with the prevailing stock price. If the stock price is below the 20 EMA, it signals a possible downtrend. But if the stock price is above the 20 EMA, it signals a possible uptrend.
Disclosure: I am not SEBI registered. The information provided here is for learning purposes only and should not be interpreted as financial advice. It is important to consult with a qualified financial advisor before making any investment decisions. Tweets neither advice nor endorsement.

Short term trade on HINDUNILVRNSE:HINDUNILVR
HINDUNILVR has created Inverted Head and Shoulders as well as a Cup and Handle pattern. For both we measure the dept of its head and cup to mark its short term target as it is on day time frame which could yield a short term gain if the neckline is broken.
Note - This is for educational purpose, in case you want to trade kindly consult your Financial Advisor
