ICICI Bank_Key Resistance Area/ All time HighICICI Bank - Price near all time high or key resistance area. Although the price is making a big green candle, volume doesn't support the breakout momentum (or atleast Breakout momentum is not created yet). Good part is - Price takes support at 20 DEMA and all other price structure looks good for potential breakout.
Watch the key area and how tomorrow going to be.
ICICIBANK trade ideas

ICICI Bank Ltd view for Intraday 22nd May #ICICIBANKICICI Bank Ltd view for Intraday 22nd May #ICICIBANK
Resistance 1450 Watching above 1452 for upside momentum.
Support area 1420 Below 1430 ignoring upside momentum for intraday
Watching below 1417 for downside movement...
Above 1430 ignoring downside move for intraday
Charts for Educational purposes only.
Please follow strict stop loss and risk reward if you follow the level.
Thanks,
V Trade Point

ICICI BANK showing bearish patternICICI BANK SHOWING clearly bearish signal as market is having some of its own issue of india pak- and stock is also at its high with profit booking face the level of 1400 is the support once it break it highly possible to reach 1350 or more down

ICICI Bank Ltd view for Intraday 5th May #ICICIBANK ICICI Bank Ltd view for Intraday 5th May #ICICIBANK
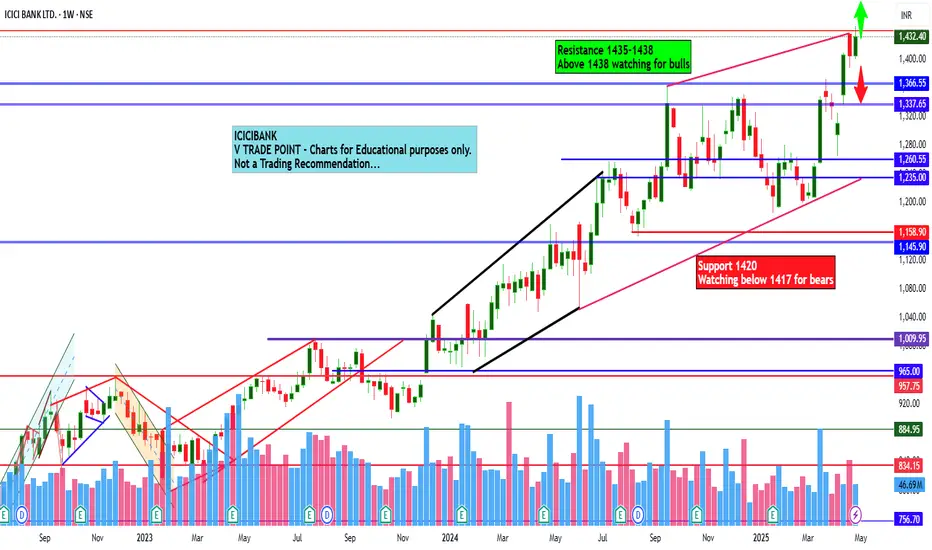
Resistance 1435-1438 Watching above 1438 for upside movement...
Support area 1420 Below 1420 ignoring upside momentum for intraday
Watching below 1417 for downside movement...
Above 1435 ignoring downside move for intraday
Charts for Educational purposes only.
Please follow strict stop loss and risk reward if you follow the level.
Thanks,
V Trade Point
ICICI Bank Ltd view for Intraday 29th April #ICICIBANK ICICI Bank Ltd view for Intraday 29th April #ICICIBANK
Resistance 1430-1435 Watching above 1435 for upside movement...
Support area 1420 Below 1420 ignoring upside momentum for intraday
Watching below 1417 for downside movement...
Above 1430 ignoring downside move for intraday
Charts for Educational purposes only.
Please follow strict stop loss and risk reward if you follow the level.
Thanks,
V Trade Point

ICICI Bank Ltd view for Intraday 28th April #ICICIBANK ICICI Bank Ltd view for Intraday 28th April #ICICIBANK
Resistance 1420 Watching above 1422 for upside movement...
Support area 1400 Below 1400 ignoring upside momentum for intraday
Watching below 1397 for downside movement...
Above 1420 ignoring downside move for intraday
Charts for Educational purposes only.
Please follow strict stop loss and risk reward if you follow the level.
Thanks,
V Trade Point

ICICI Bank Ltd view for Intraday 23rd April #ICICIBANK ICICI Bank Ltd view for Intraday 23rd April #ICICIBANK
Resistance 1420-1425 Watching above 1430 for upside movement...
Support area 1400 Below 1400 ignoring upside momentum for intraday
Watching below 1397 for downside movement...
Above 1420 ignoring downside move for intraday
Charts for Educational purposes only.
Please follow strict stop loss and risk reward if you follow the level.
Thanks,
V Trade Point

ICICI Bank Ltd view for Intraday 22nd April #ICICIBANK ICICI Bank Ltd view for Intraday 22nd April #ICICIBANK
Resistance 1420-1425 Watching above 1430 for upside movement...
Support area 1400 Below 1400 ignoring upside momentum for intraday
Watching below 1397 for downside movement...
Above 1430 ignoring downside move for intraday
Charts for Educational purposes only.
Please follow strict stop loss and risk reward if you follow the level.
Thanks,
V Trade Point

Review and plan for 22nd April 2025 Nifty future and banknifty future analysis and intraday plan in kannada.
This video is for information/education purpose only. you are 100% responsible for any actions you take by reading/viewing this post.
please consult your financial advisor before taking any action.
----Vinaykumar hiremath, CMT

icici bank 1620 or 1380icici bank 1620 or 1380
ICICI Bank recently announced its Q4 FY25 results, showing an 18% increase in net profit to ₹12,630 crore. The bank also declared a ₹11 per share dividend, reflecting strong financial performance. Analysts expect stable net interest margins (NIMs) and encouraging credit growth, though some margin pressure may arise due to the recent repo rate cut by the RBI.

Positional Trade Setup: ICICI Bank Ltd (NSE: ICICIBANK)Key Technical Observations
Current Price: ₹1,406.70 (Near key resistance)
Key Levels:
Support: ₹1,350 (Strong Base) → ₹1,300 (Major Swing Low)
Resistance: ₹1,500 (Psychological Level) → ₹1,600 (2024 High)
Trend Indicators:
TEMA (5,9,20): Bullish alignment (short-term momentum intact).
SuperTrend (10,3): Green line → Uptrend confirmation.
Price Action: Consolidating near ₹1,400; breakout above ₹1,420 could trigger next rally.
Fundamental Checks (Screener.in Recommended)
Sector: Banking (Private Sector Leader)
Growth Drivers:
Loan book expansion (+15% YoY)
Stable NIMs (~4-4.5%)
Consistent ROE (~16-18%)
Valuation: P/B ~2.5 (Fair for sector).
Trade Execution Plan
✅ Entry Zone:
Conservative: ₹1,380-1,400 (Dip near support)
Aggressive: Above ₹1,420 (Breakout confirmation)
🛑 Stop-Loss: ₹1,320 (Below recent swing low)
🎯 Targets:
₹1,500 (7% upside)
₹1,600 (14% upside – Trail SL)
⏳ Holding Period: 1-3 months (Banking stocks trend with Nifty).
Confirmation Signals
Volume: Surge above 20-day avg on breakout.
Sector Trend: Monitor Bank Nifty (support at 46,000).
Earnings Date: Next quarterly results (check Screener.in).
Risk Management
Avoid if RBI hikes rates unexpectedly.
Exit if price closes below SuperTrend line.
Final Verdict: Strong technical structure + sector tailwinds = High-probability trade. Pair with fundamentals for conviction.

Icici Bank trend directionIcici bank 1311 has a W patteren and is trying to hold the confirmation line. If it could hold the confirmation line could move higher. If not , It would test target 1215
News : ** HSBC identifies five Indian stocks — Reliance Industries
RELIANCE1!, ICICI Bank ICICIBANK , TVS Motor TVSMOTOR, Shriram Finance SHRIRAMFIN, and Adani Ports ADANIPORTS — as its top picks offering profit visibility
in.tradingview.com/symbols/NSE-ICICIBANK/forecast/
What is ICICIBANK stock forecast?
We've gathered analysts' opinions on ICICI BANK LTD. future price: according to them, ICICIBANK price has a max estimate of 1,710.00 INR and a min estimate of 1,290.00 INR. Watch ICICIBANK chart and read a more detailed ICICI BANK LTD. stock forecast: see what analysts think of ICICI BANK LTD. and suggest that you do with its stocks.

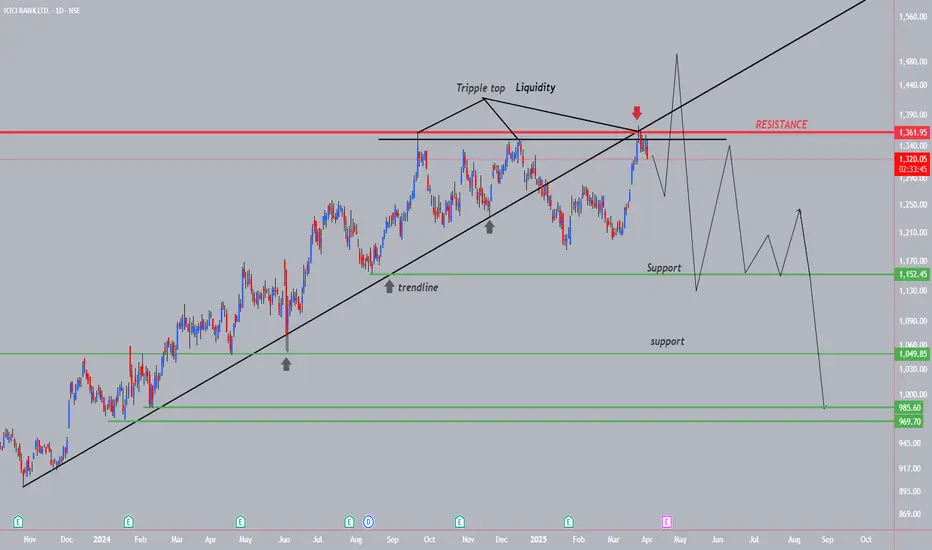
ICICIBANK--Tripple Top Liquidity+Down??This banking sector stock has broken the trendline strongly...
recently price taken the double top liquidity, creating an another liquidity....
do not make any attempt of short from this levels, still we don't have a sign of bearishness....
wait for one more liquidity on topside with strong upside move as exhaustion
then will observe a strong fall, after the liquidity...
then will go for short side...
on the bottom side we have a lot of trendline liquidity lies at support levels.
we have to look for buy at these levels for an investing point of view.
Should You Invest in ICICI Bank or Wait?Technical Analysis:
The stock is currently trading at its all-time high of ₹1,367, which may appear attractive to new investors.
However, a triple top pattern is forming, indicating potential resistance at this level.
This pattern is considered a bearish signal, suggesting that the stock may face rejection from this level.
A potential downtrend toward ₹1,200 seems likely based on this pattern

Long ICICI BankSince August 2021, ICICI Bank stock has been trading nicely between Revenue/share multiple of 3, 3.5 and 4. That means it is trading at 3 to 3.5 times it's revenue per share. It is clearly visible using Revenue Grid Indicator applied on daily chart. As per that, this is a good time to buy for a long term view. We can wait for 21 Apr 2025 for it's next earnings results also :) Happy Trading :)

ICICI Bank is under strong bearish pressure.🔴 ICICI Bank is under strong bearish pressure.
ICICI Bank is one of India’s top banks, based in Mumbai. They’ve got a massive network with over 6,600 branches and 16,000 ATMs across India. They’re known for their innovative banking solutions and have a strong presence in 11 countries.
They’re considered a Domestic Systemically Important Bank by the Reserve Bank of India, which means they’re pretty crucial to the Indian banking sector.
✅ What pattern is unfolding in NYSE:IBN ?
IBN created a triangle Chart Pattern that is usually considered a continuation of the trend, but in this case, there was a bullish breakout that quickly lost its effect. This is one of the most important bearish signals, especially if the pattern ends up breaking on the other side.
💰 How to trade this chart pattern?
The ideal strategy is to sell once the blue trendline, which acts as price support, is broken. In this case, there was an initial rebound on December 20th that confirmed it, and then it broke, starting its downward movement. We could see a 7% drop in the coming days.
🛡️ The risk management strategy
As we have done in so many previous ideas, remember you can split the position in 2.
- 50% of the position in a take profits, at least, as large as your stop loss (adapt SL and this 1st TP to local supports/resistance levels). In this case, a 2% TP for 2% SL.
- 50% of the position to a price as large as the previous pattern, which would mean a profit of 7%.
✴️ ENJOY AND FOLLOW for more 😊
You can find statistics for all patterns on our website, as well as the most interesting patterns currently unfolding.

ICICI Bank: Is Another 30% Slide Around the Corner?The weekly chart of ICICI Bank reveals an intriguing historical pattern. Since 2008, the stock has experienced at least six significant corrections, each exceeding 30% from its peak. Despite its robust long-term uptrend, these periodic downturns highlight the cyclicality of market behavior and investor sentiment.
Key Observations from the Chart:
Historical Drawdowns:
The stock corrected 76.93% in 2008 during the global financial crisis.
Subsequent corrections were smaller but still significant, ranging from 25.93% to 54.05%.
The last substantial dip occurred in the COVID-19 market crash.
Current Sentiments:
The stock appears to be trading near its historical highs, but the overall market mood remains weak.
The Stochastic RSI is nearing the oversold zone, a signal that has often preceded sharp declines in the past.
The Macro Backdrop:
High Inflation: Persistently elevated inflation is eroding consumer spending and corporate margins.
Higher Interest Rates: Central banks worldwide are maintaining a tight monetary policy, which could hinder credit growth and profitability for banks.
Low Earnings Growth: ICICI Bank’s recent earnings have failed to excite the market, casting doubts on its ability to sustain high valuations.
FII Selling Pressure: Foreign Institutional Investors (FIIs) have been consistent net sellers, further weighing on the stock price.
Speculative Outlook:
Given the confluence of weak market sentiment, macroeconomic headwinds, and the stock's historical tendency to correct sharply after extended rallies, a potential 30% downside cannot be ruled out. The key support zones to watch are the 50-week moving average and the 200-week moving average, which have acted as reliable floors during previous corrections.
SIP Opportunity:
Should the stock break below its 50-week moving average, this could present a good opportunity for investors to accumulate shares in a SIP mode. The 50-week MA often acts as a psychological and technical support, and a breach could allow long-term investors to enter at attractive valuations.
Key Levels to Watch:
Immediate Support: ₹1,200-1,190 (50-week MA)
Deeper Support: ₹913-915 (200-week MA)
Conclusion:
While ICICI Bank remains a fundamentally strong player in the Indian banking space, the short-term outlook appears challenging. Traders and investors should brace for potential volatility and look for buying opportunities closer to historically significant support levels. SIP investors, in particular, can benefit from phased accumulation during corrections.

KEY LEVELS FOR 18/02/2025//description
// All credit goes to Tony for the concept of this indicator. His Trading View link: www.tradingview.com
// Note: The calculation method in this indicator differs from Tony's, but the concept is derived from his work.
I want to make it clear that I am not a seller, and this method was not taught to me by anyone. The original creator only gave me one clue:
👉 "If you get one level, you get all levels."
Everything else—the way I nail it the method and applied it—is my own work. I respect the original idea, but my approach is independent.
Explanation:
This trading system helps you avoid blind trades by providing confirmation for better entries and exits.
Entry/Exit Points:
- Entry/Exit Lines: Use the BLACK line for long trades and the RED line for short trades, based on confirmation from your trading plan.
- Stop Loss: For long trades, set the stop loss at the RED line below. For short trades, set it at the BLACK line above.
- Take Profit: For long trades, target the next RED line above. For short trades, target the next BLACK line below.
Timeframe:
Use a 5 mins timeframe for trading.
Risk Disclaimer:
This setup is for educational purposes. I'm not responsible for your gains or losses. Check the chart for more details.
ICICIBANK KEY LEVELS FOR 17/02/2025//description
// All credit goes to Tony for the concept of this indicator. His Trading View link: www.tradingview.com
// Note: The calculation method in this indicator differs from Tony's, but the concept is derived from his work.
I want to make it clear that I am not a seller, and this method was not taught to me by anyone. The original creator only gave me one clue:
👉 "If you get one level, you get all levels."
Everything else—the way I nail it the method and applied it—is my own work. I respect the original idea, but my approach is independent.
Explanation:
This trading system helps you avoid blind trades by providing confirmation for better entries and exits.
Entry/Exit Points:
- Entry/Exit Lines: Use the BLACK line for long trades and the RED line for short trades, based on confirmation from your trading plan.
- Stop Loss: For long trades, set the stop loss at the RED line below. For short trades, set it at the BLACK line above.
- Take Profit: For long trades, target the next RED line above. For short trades, target the next BLACK line below.
Timeframe:
Use a 5 mins timeframe for trading.
Risk Disclaimer:
This setup is for educational purposes. I'm not responsible for your gains or losses. Check the chart for more details.

ICICI BankMultiple Chart Pattern
1. Narrow Range Breakout
2. Pole Pattern
3. Double Bottom Pattern
RSI crossing 60 D /W
Monthly RSI Above 60


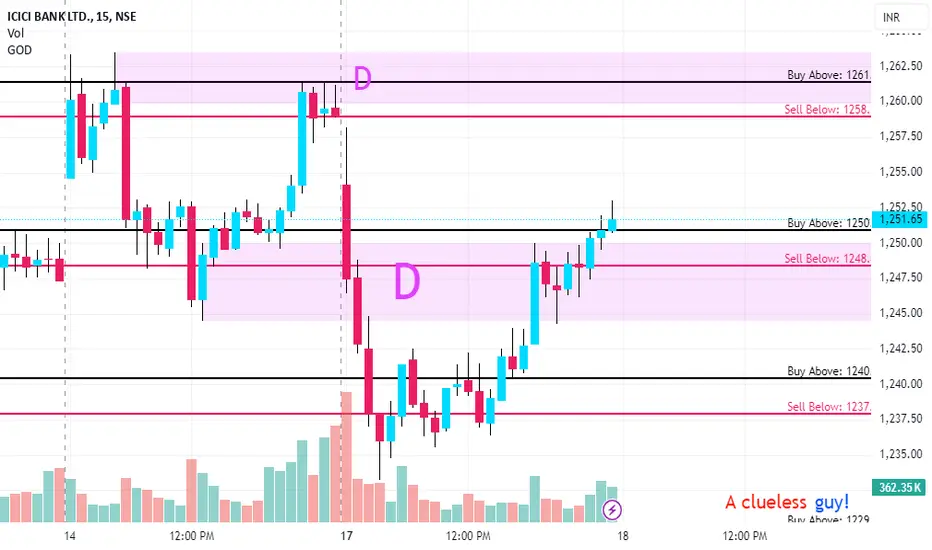
ICICIBANK KEY LEVELS FOR 03/02/2025**Explanation:**
This trading system helps you avoid blind trades by providing confirmation for better entries and exits.
**Entry/Exit Points:**
- **Entry/Exit Lines:** Use the BLACK line for long trades and the RED line for short trades, based on confirmation from your trading plan.
- **Stop Loss:** For long trades, set the stop loss at the RED line below. For short trades, set it at the BLACK line above.
- **Take Profit:** For long trades, target the next RED line above. For short trades, target the next BLACK line below.
**Timeframe:**
Use a 5 mins timeframe for trading.
**Risk Disclaimer:**
This setup is for educational purposes. I'm not responsible for your gains or losses. Check the chart for more details.

ICICI BANK | LONG | BTSTICICI BANK is reversing from the Lows and the Price action is showing clear Bullishness.
A BTST type trade is setting up for a Target to 1268 price level.
SL - Today's low.
