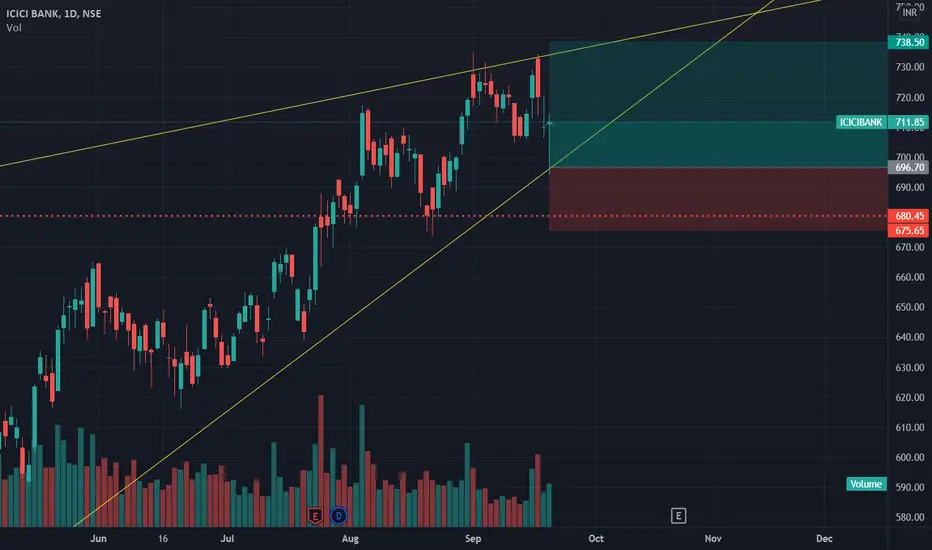
ICICI trend analysis for November monthThe bank is in strong bull movement from last October and it didn't break the trend line yet. As the bank broke the February high with high volumes in September and moving 25% higher to market price.
From the chart the stock is having strong support at 680 and it could consolidate for next 4-6 weeks in the range from 700~840.
We can wait for buying the stock at support levels with stop loss of 620-640
Range - 700 ~ 840
Resistance - 830-850
Support - 715-750
ICICIBANK trade ideas

ICICI BANK INTRADAY LEVELS FOR FRIDAY 29TH OCT 2021Red zones are resistance areas and blue zones are support areas.

Icici bank1 hoir char tringle pattern... Break a trad line tommro short...
#icici bank
#NSE
#banknifty

ICICI BANK INTRADAY LEVELS FOR WEDNESDAY 27TH OCT 2021Red zones are resistance areas and blue zones are support areas.

Bullish cup & handle in ICICIBANKICICI Bank has broken cup and handle pattern and have retested and moved up from the level. there is high probability of it to test the price of 800) in coming 1-2 months. If BANKNIFTY will remain sideways or bullish then it it will surely touch 800.
These are my view on the etries
accumulation zone 667.5-670
distribution zone 750-800
Risky zone 650 or below
Price should move up equivalent to depth of the cup ~140 points from entry zone as per theory.
PS: do your own analysis before taking entry based on this anaysis

ICICI BANK INTRADAY LEVELS FOR TUESDAY, 26th OCT 2021Red areas are resistance zones and blue areas are support zones.
Thank you!

Breakout of Channel patternICICI has JUST POPPED out of the channel....and today 23rd Oct was the quarterly (Q2) earnings results of the bank....the bank has posted a 30% growth from same time last year - PAT grew to 5511 crores and more importantly outperformed Nifty Bank which grew 21% in the same period...another significant thing - Non Performing Assets ( NPA) is lowest since 2014...which is all good news but we have to wait and see how market reacts to this news...as we know when results are poor the stock shoots up and when results are good the stock does not find favour with the market makers...let us wait and see its opening on Monday. Targets are not marked but f it opens with a gap up then 792, 1016 are the long term targets.

Pvt banks vs PSU banksRatio chart comparison of the pvt bank index vis a vis the bank nifty and also the psu bank index vis a vis the bank nifty

Buy Setup with Breakout in #ICICIBANKToday there was a breakout in ICICIBANK. Buy ICICIBANK between 720-25 with SL 707 for targets 745-50 in a few days.
For educational purpose only. All disclaimers apply.

ICICIBANK - Daily NeoWaveICICIBANK almost finished expanding triangle in daily wave chart. Mimimum target will be 720.


ICICIBANK AnalysisTriple Top Pattern in ICICIBANK (Bearish Chart Pattern)
If 685 is broken and it sustains below this level
Next Downside Targets: 675,665

short ICICIBANKHuge resistance and upper triangular pattern suggest bearish move in coming days for ICICIBANK


ICICIBANKIf ICICIBANK breaks 715 & holds above it thn it negates Bearish H&S pattern & turns bullish.
So buy ICICIBANK above 715 with sloss 705 (neckline) & tgt 735..

ICICI BankIcici is trading in a flag pattern on hourly chart. Once it breaks the upper trend it is going towards its immediate high.
Target 1 - 734
Target 2 - 754
The above analysis is for information purpose only. Do your own analysis and consult your financial advisor before taking any position.

ICICI Bank ReversalThe stock has reached lower trendline and may undergo a reversal rally. Trade is supported by brokerage calls and Supports Nearby.
Risk Reward Ratio - 2:1
SL is placed below support zone & the lower trendline. The target is placed based on fundamentals and near all time high.
good opportunity to sell1.sell @ 715
2.first@ 666
3.second@ 586
due to global scenrio and market correction
i see that icici bank fill the gap good opportunity
to sell and take profit

Broaden wedge pattern brokeStock Analysis: ICICI has broken the broaden wedge pattern, it is good buy around marked demand area for conservative entry for the longterm target given on the chart. Let's see..
Happy Investing!


ICICI BANK 15MINafter retrenchment ICICI bank Performs a uptrend move
We can initiate the BUY position for TARGET 720 725 740
with small Stop Loss 712

ICICI Bank complete BlastICICI Bank analysis is shared on 31st July. In few days, stock is 8% up. This is a perfect breakout of Cup with handle. I hope you all are enjoying the good returns.

ICICIBANK - Potential setup!It has a good respect for the 40 ema, Followed by the formation of a pinbar candle at the demand zone.
Also, RSI takes a reversal near this zone, almost everytime.
