ICICI GI Long_Support at 20 Daily EMAICICI GI Long:
- Price takes support at 20 DEMA
- 2 days before the Earnings call (Caution)
- Enter long when the prices favorable in the lower timeframe
- SL: CLose below 20 DEMA
ICICIGI trade ideas

ICICI LOMBARDOn the verge of giving breakout of cup and handle pattern. If volume supports the breakout, it will shoot up in no time.
ICICIGI | Buy @LTP | SL below 1865 | Targets 2170, 2280, 2950Disclaimer:
This is not financial advice. Please do your own research or consult with a financial advisor before making any investment decisions. Investments in stocks can be risky and may result in loss of capital.

ICICIGI breakout inverse head and shoulders pattern bullish activated
The bullish inverse head and shoulders pattern is a chart formation that signals a potential shift from a bearish trend to a bullish one

ICICIGI - A comfortable Triple bottom pattern Analysis:
This chart indicates a potential triple bottom pattern, which is a bullish reversal pattern. This pattern typically forms after a downtrend and suggests that the stock may reverse its trend upwards.
Support: The triple bottom is forming around the 17880 level, indicating strong support at this price.
Resistance: The immediate resistance level is around 1,879.95, with a stronger resistance at 2,000.00.
The formation of a triple bottom is a positive sign, but confirmation at resistance through a breakout with high volume is crucial before taking a buy position. Monitor the price action around the resistance levels and moving averages for additional confirmation signals.

ICICIGI Swing TradeHello,
Trend-Based Analysis. Buy the Dips, Sell The Rallies, Also Following the Trend. Let's see where the Price Action takes us, Riding the wave. Potential trade setups based on trend momentum.
Technical analysis based on trend identification and momentum, Looking for high-probability setups within the prevailing trend.
Analyzing the current market trend and potential future price movement. Focusing on risk management and reward-to-risk ratios.
Details is Mentioned in Chart, Read carefully.. .

ICICI Lombard GIC Ltd. - Technical AnalysisPrice Action:
The stock recently took support near the 0.5 Fibonacci retracement level around ₹1,892, bouncing back with strong momentum. This aligns with a visible bullish RSI divergence as the price formed lower lows while the RSI made higher lows, signaling a potential reversal.
Key Levels (from Fibonacci):
Resistance 1: ₹1,987 (61.8% Fibonacci level)
Resistance 2: ₹2,127 (78.6% Fibonacci level)
Final Target: ₹2,299 (Fibonacci extension, previous high)
Support 1: ₹1,892 (0.5 Fibonacci level, current support)
Support 2: ₹1,796 (38.2% Fibonacci level)
Support 3: ₹1,677 (23.6% Fibonacci level)
Entry, Stop Loss, and Targets:
Entry: Around ₹1,940-₹1,950 (post breakout confirmation above ₹1,950).
Stop Loss: ₹1,875 (below the 0.5 Fibonacci level and near recent support).
Targets:
Target 1: ₹1,987 (61.8% Fibonacci level)
Target 2: ₹2,127 (78.6% Fibonacci level)
Target 3: ₹2,299 (previous swing high)
Volume and RSI Observations:
The volume profile shows increased participation near ₹1,900 levels, confirming accumulation.
RSI is recovering from oversold levels and shows divergence, supporting a potential bullish continuation.
Conclusion:
If the stock holds above ₹1,892, the bullish trend might continue toward ₹1,987 and higher targets. Maintain discipline with the stop-loss to manage risk effectively.

ICICIGI - LONGNSE:ICICIGI Weekly chart showing price near at parabolic location with doji formation may end near here. Momentum still bullish near to medium term.

$ICICIGI bounce back 13R ?NSE:ICICIGI has a good possibility to take out the short IDM on top . bouncing off weekly demand.

ICICI Lombard - Swing Long Setup with Key LevelsThis chart shows a potential long trade setup on ICICI Lombard, highlighting a possible rebound from recent lows. Here's my trade plan:
Entry Zone: Waiting for a 15-minute candle to break above 2096.50 . The high of that 15-minute candle will be my entry point.
Stop Loss: If any 1day candle closes below 2050.50 , I'll exit the trade.
Target: 2188.50
This setup offers a good risk-reward ratio. If we see a strong breakout above the entry zone with decent volume, the price could move towards the target of 2188.50. However, if the stop loss level is breached on a 1day close, I’ll exit the position to protect capital.
Note: This is not any financial advice and for education purpose only.

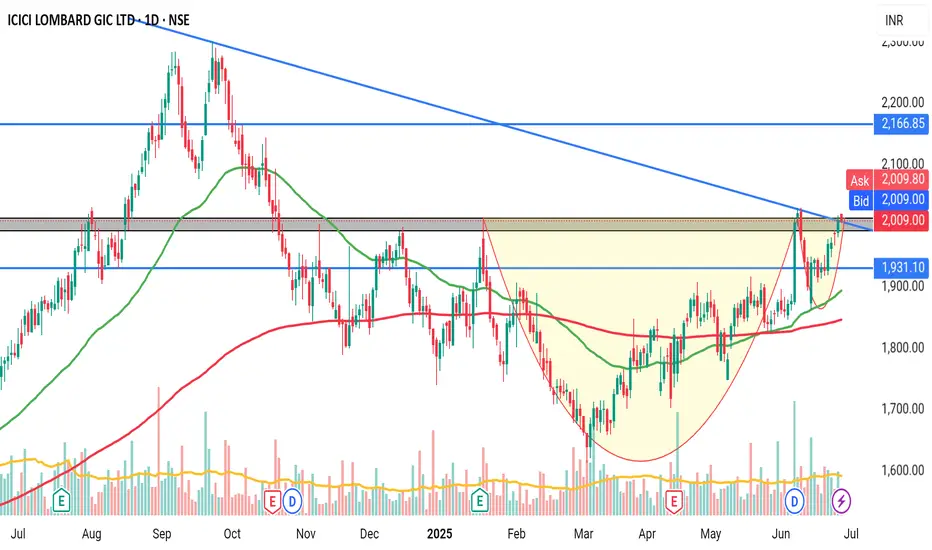
ICICI LOMBARD S/R Support and Resistance Levels:
Support Levels: These are price points (green line/shade) where a downward trend may be halted due to a concentration of buying interest. Imagine them as a safety net where buyers step in, preventing further decline.
Resistance Levels: Conversely, resistance levels (red line/shade) are where upward trends might stall due to increased selling interest. They act like a ceiling where sellers come in to push prices down.
Breakouts:
Bullish Breakout: When the price moves above resistance, it often indicates strong buying interest and the potential for a continued uptrend. Traders may view this as a signal to buy or hold.
Bearish Breakout: When the price falls below support, it can signal strong selling interest and the potential for a continued downtrend. Traders might see this as a cue to sell or avoid buying.
20 EMA (Exponential Moving Average):
Above 20 EMA(50 EMA): If the stock price is above the 20 EMA, it suggests a potential uptrend or bullish momentum.
Below 20 EMA: If the stock price is below the 20 EMA, it indicates a potential downtrend or bearish momentum.
Trendline: A trendline is a straight line drawn on a chart to represent the general direction of a data point set.
Uptrend Line: Drawn by connecting the lows in an upward trend. Indicates that the price is moving higher over time. Acts as a support level, where prices tend to bounce upward.
Downtrend Line: Drawn by connecting the highs in a downward trend. Indicates that the price is moving lower over time. It acts as a resistance level, where prices tend to drop.
RSI: RSI readings greater than the 70 level are overbought territory, and RSI readings lower than the 30 level are considered oversold territory.
Combining RSI with Support and Resistance:
Support Level: This is a price level where a stock tends to find buying interest, preventing it from falling further. If RSI is showing an oversold condition (below 30) and the price is near or at a strong support level, it could be a good buy signal.
Resistance Level: This is a price level where a stock tends to find selling interest, preventing it from rising further. If RSI is showing an overbought condition (above 70) and the price is near or at a strong resistance level, it could be a signal to sell or short the asset.
Disclaimer:
I am not a SEBI registered. The information provided here is for learning purposes only and should not be interpreted as financial advice. Consider the broader market context and consult with a qualified financial advisor before making investment decisions.

ICICI Lombard General view for Intraday 26th September #ICICIGIICICI Lombard General view for Intraday 26th September #ICICIGI
Buying may witness above 2280
Support area 2250. Below ignoring buying momentum for intraday
Selling may witness below 2230
Resistance area 2250
Above ignoring selling momentum for intraday
Charts for Educational purposes only.
Please follow strict stop loss and risk reward if you follow the level.
Thanks,
V Trade Point

ICICI Lombard General Insurance view for Intraday 23rd SeptemberICICI Lombard General Insurance view for Intraday 23rd September #ICICIGI
Buying may witness above 2255
Support area 2200. Below ignoring buying momentum for intraday
Selling may witness below 2198
Resistance area 2240-2250
Above ignoring selling momentum for intraday
Charts for Educational purposes only.
Please follow strict stop loss and risk reward if you follow the level.
Thanks,
V Trade Point

ICICIGINSE:ICICIGI
One Can enter now!
Or Wait for a retest of the trendline(BO)!
Or Wait for a better Risk:Reward Ratio!
Note :
1. One should go long with a StopLoss, below the Trendline or the Previous Swing Low.
2. Risk :Reward ratio should be minimum 1:2.
3. Plan your trade as per the Money Mangement and Risk Appetite.
Disclamier : You are responsible for your profits and loss.
The idea shared here is purely for Educational purpose.
Follow back, for more ideas and thier notifications on your email.
Support and Like incase the idea works for you.

ICICI Lombard General Insurance intraday level for 21st Aug #ICIICICI Lombard General Insurance intraday level for 21st Aug #ICICIGI
Buying may witness above 2071
Support area 2050. Below ignoring buying momentum for intraday
Charts for Educational purposes only.
Please follow strict stop loss and risk reward if you follow the level.
Thanks,
V Trade Point

ICICIGIResistence converted as a support line... so its very new level have very good potencial of moving upwards.. follow the rules based trading and make money systamtically

ICICI Lombard General intraday level for 19th Aug #ICICIGI ICICI Lombard General intraday level for 19th Aug #ICICIGI
Buying may witness above 2050
Support area 803. Below ignoring buying momentum for intraday
Charts for Educational purposes only.
Please follow strict stop loss and risk reward if you follow the level.
Thanks,
V Trade Point

ICICI Lombard breaksoutICICI Lombard BSE:ICICIGI breaksout of a flag pattern. You can buy above 1980 and Target would be 2450

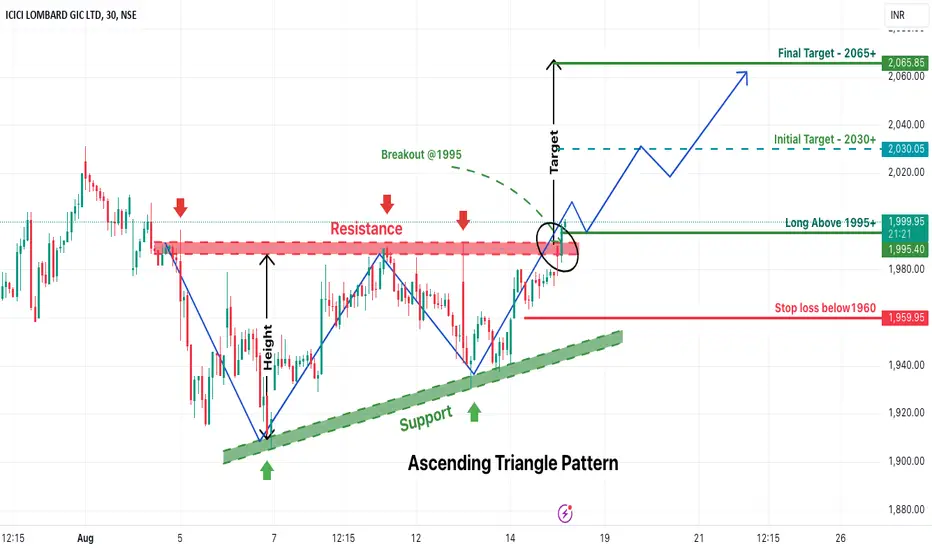
Ascending Triangle Pattern Breakout in ICICIGIICICI Lombard General Insurance (ICICIGI) Analysis – 30-Minute Timeframe
On the 30-minute timeframe, ICICI Lombard General Insurance (ICICIGI) has displayed a bullish breakout from an Ascending Triangle pattern, which is typically considered a bullish pattern indicating potential upward momentum. The breakout suggests a strong buying interest, with expectations of an upside rally in the stock.
Key Levels:
Entry Point: An entry opportunity is identified above the 1995 level, which acts as a confirmation of the breakout.
Stop Loss: To manage risk, a stop loss is recommended just below the 1960 level. This level serves as a crucial support, and breaking below it may invalidate the bullish setup.
Target Levels:
Intermediate Target: The first target for this trade is set at 2030, where partial profits could be booked.
Final Target: The final target is anticipated at 2065 or above, aligning with the expected continuation of the bullish trend post-breakout.
ICICI Lombard General Insurance intraday level for 16th Aug #ICIICICI Lombard General Insurance intraday level for 16th Aug #ICICIGI
Buying may witness above 2015
Support area 1065. Below ignoring buying momentum for intraday
Charts for Educational purposes only.
Please follow strict stop loss and risk reward if you follow the level.
Thanks,
V Trade Point

ICICI Lombard General Insurance ntraday level for 1st Aug #ICICICICI Lombard General Insurance ntraday level for 1st Aug #ICICIGI
Buying may witness above 2022
Support area 1995-2000. Below ignoring buying momentum for intraday
Charts for Educational purposes only.
Please follow strict stop loss and risk reward if you follow the level.
Thanks,
V Trade Point

ICICIGI Strong Weekly CloseAdd the dips and wait for new ATH. Closed well above the marked resistance zone and confluence VWAP green line.
Your SL and your target. I will be holding this for long. May test your patience

SWING IDEA - ICICI LOMBARD GENIn this analysis, we will explore key technical indicators and chart patterns that suggest ICICI Lombard GEN may be poised for a favorable uptrend. We'll delve into the factors contributing to the positive sentiment surrounding the stock.
Reasons are listed below :
The 1410 levels underwent multiple tests before the price eventually broke through. Currently, the price is in the process of retesting those levels.
Hammer candle (positive sign) on a very crucial support zone.
50EMA support on daily timeframe.
0.382 Fibonacci support.
Stock price is above 50 and 200EMA i.e the trend is intact.
Target - 1490 // 1611
StopLoss - Daily close below 1370
