Idea - Analysis and discussion IDEA - Analysis for discussion
Buying Zone :- 10.55 to 14
Stop loss - 7.45
Can Idea a hit below targets? What you think? Please let me know your thoughts in comments.
First Target - 22.5
Second target around 27 (around 2x from CMP!!)?
Please do your due diligence before trading or investment.
Thank you.
IDEA trade ideas

Hidden Bullishness in VI ??Hi, Let's try to understand what is cooking in VI stock through price action
- VI has corrected almost %50+ and it will still correct if any positive news will not come in market.
- Now let's have a look what are the key levels of support as we can see from weekly chart key support level is at around 7 - 7.75 levels.
- The reason is clearly seen in chart when Stock has come to that level 2-3 times it has bounce back till 13.50 or more than that, so it's a good opportunity to buy around that levels and it can definitely give 50% or more return
- Not giving SL levels as it's a risky whiskey trade____ Risk hai to Ishq hai...Lol
- Cut the finger otherwise you have to cut your whole hand (same goes with loss as well smart one will understand and they will cut the loss accordingly).
*** THIS IS NOT A BUY SELL RECOMMENDATIONS ITS ALL MY PERSONAL VIEW ***

Effect of Bad idea is not overI am also a victim of a bad idea. But hopefully it will be over by 15 Jan 25. Feared that will it go back to 5.6 . God save us

POTENTIAL INVESTMENT TARDE FOR VODAFONE IDEA
Here we look at the Quarterly chart since 2008, We see price was rallying up violating Resistances and respecting the Support areas, until it starts doing the opposite.
Now recently Price has violated a Supply area which indicates that the Buyers have just won over the sellers and now Price has given a Pullback in a 6 Months Demand.
Now we have a 6 Months Demand; So understanding the timeframe role into this Trade as the Demand in which we buy this a 6 months Demand hence we will have to consider a minimum of 1 to 2 years considering at least 2 to 4 candles of 6 months each to achieve the Target.
Here we have the following to consider before entering the Trade
Trade Type : Investment Trade
Entry : 10.10
SL : 5.70
TGT : 39.74
Risk : Rs. 4.4
Reward : Rs. 29.64
Ratio for Reward to Risk : 6.7/1

Vodafone IDEA Vs Media (The Art of Creating Panic)Vodafone Idea is a Great Example and a Very Easy pick for Pathetic Media Channels to nitpick for Triggering Undue Panic among Retailers
Look at how the Media houses unfolded their evil plans
News # 1 - Thursday 19th Sep - Vodafone's Target price slashed criminally to Rs. 2 (from Rs. 13)
This caused the Price to crash -19.53% on Thursday and we immediately said NOTHING would happen to Voda as the SC's judgement is common to all Telecom operators involved in the Curative Petition, but Media Channels like NDTV painted a Blood-bath picture only on Vodafone as its the Weakest. Both Reliance Jio and Bharti Airtel were trading Positive on Thursday.
www.ndtvprofit.com
News # 2 - Friday 20th Sep - Clarification that the Curative petition does not affect the lenders
By this time the Price recovered from 9.8 to 10.5
telecom.economictimes.indiatimes.com
News # 3 - Monday 23rd Sep - Conclusion of Mega Deal with Vendors and Lenders
Now today Idea blasted over +10% intraday, but now trading around +6.5%
x.com
Media Houses are Making a Royal Fool out of the Investors and Retailers. Before an investigation could complete, they write articles creating Negative Hype, Crashing the market and making People lose Money
Is this Ethical ?????
Anyways, On the Monthly chart - watch carefully as the Price started taking Resistance on Jun 28th itself from the peak of 19. The Fall was triggered almost 3 months before all these Bullshit news came out and now the recovery has started
But this is NOT yet the end of the story, the price WON'T take a V-Shaped Recovery, the price would fall again to 10.5 zone and go sideways to accumulate power and then finally Blast out to hit the previously given targets of 19, 25, 30
So, people who are looking to Average - NO NEED TO RUSH. Wait for the interim falls to 10.5 levels and sideways movement. It will give you ample opportunities to average at lower levels, but at the same time - there is absolutely no need to Panic

IDEA is at buying zone and possibly a another 25 - 35% rally?NOTE: I am not a professional investor; I have only two years of experience in stocks and investing. Please refrain from making any trades based on my chart analysis, as this is solely for community learning purposes.

vi bullish short termchart looks promising, for short term trading gains at support. in buying range

VODAFONE IDEA - At an important SupportVodafone idea technically looks good
with favorable risk reward ratio
With strict SL of 15.5, it can be kept in the watchlist for upmoves
Disclaimer: Only for Study Purposes. No recommendation.

Idea forming a Cup n Handle formationIdea has a good strong chart setup for September month I am expecting Target 17.8/19+
Even 22 in short term possible in IDEA.

IDEA:CUP AND HANDLE FORMATIONThe NSE:IDEA is currently forming a classic Cup and Handle pattern. This bullish continuation pattern suggests a potential upward movement once the pattern completes and breaks out. Here's a detailed breakdown of the pattern and the trading strategy:
1. Cup Formation:
The stock has undergone a rounded bottom, creating the "cup" part of the pattern.
The left side of the cup was formed due to a decline in price, reaching a bottom before rising back up to the original level.
This cup formation indicates a period of consolidation and accumulation, where buyers are gradually gaining control.
2. Handle Formation:
Following the completion of the cup, the stock entered a small consolidation phase, forming the "handle."
The handle typically slopes downward or moves sideways, showing a slight pullback.
This pullback is generally short-term and should not exceed more than one-third of the cup's depth.
3. Breakout Point:
The ideal entry point for traders is the breakout above the handle's resistance level.
Traders should look for a significant increase in volume during the breakout to confirm the move.
Target:
The target price can be determined by measuring the depth of the cup and adding it to the breakout point.
Target Price Calculation:
Target Price: 25
Stop Loss:
Place the stop loss below the lowest point of the handle to protect against a false breakout.
Stop Loss Price: 15.
Disclaimer: This analysis is for informational purposes only and should not be considered as financial advice. Always conduct your own research and consult with a financial advisor before making any trading decisions.

Vodafone Idea - The Myth BusterWhen it comes to stocks from the Small / Mid Cap category (or) especially from the Penny Stock section, I see everyone shivering in fear to take entries. Even if they take entries boldly, when they see a fall, they start to shiver and exit in Panic either in minimal Profits or sometimes even in Loss
One such "Mythical" Stock is Vodafone Idea. Almost no one talks positive about it, and every fundamental investor is strictly against it
Let me ask you All 1 question - if this stock is so fragile / so risky / so unpredictable - then why don't we see "erratic patterns" on charts ??? Shouldn't there be sudden spikes and sudden falls ? I don't see any such thing....
i.pinimg.com
On Weekly:
The price is going thru a Beautiful Cup and Handle pattern, but is just unable to break out of 19 levels despite 3 attempts - Why ?
On Daily:
The answer to the above question lies within the Daily timeframe chart. From when it first touched 19 level in early 2024, till now, the price is actually forming an Inverted Head and Shoulder Pattern which is embedded within the Handle portion of C&H
Based on Support and Fib levels, the price WILL take U turn from 15.5 (Fib 0.5) or 14.6 (which is much strong Fib 0.618 Golden Ratio - combined with Strong Support as well)
Fresh entries / Averaging can be done around 15.5 (light) or 14.6 (heavy) once bullish reversal signal is seen
Targets still intact 19, 24, 30
-------------------------------------------------------------------------------------------------
True story....
When I was in 3rd grade, playing and running with my friends a stray dog chased me and scratched me on my back. I didn't know whether it bit me or just nails
I was so scared to tell my parents as I was afraid of the infamous 24 or 36 injections around the belly button - back those days....But friends told my mom and she rushed me to hospital and Dr confirmed that it's just a nail scratch not a bite and 1 injection was enough
But until I was grown up, the sight of any dog would scare me to death.... A loud bark would give me shivers. When I learnt how to control dogs and how to pet them, the fear is gone
Unfortunately, this is exactly what we are passing on to our next generations
We might have been attacked or even bit by a dog (Penny stock or High Beta Stocks) but what is the Learning you are passing on ? To run away from them ? Remember - if you run away from a Dog it will Chase you....
If the answer is still to run away, then sorry my friends - you haven't learnt anything from your bad experience. You may run away from a Penny stock today, but if similar instances and issues arises on the likes of Yes Bank, ICICI (Kocchar scam) or Varanium Cloud - are you prepared to handle them and what do you pass on to your next generation ???
The Chart 📈 is my Magic Butter Biscuit 🍪. It can TAME any Dog
Learn to Ride the Tide, irrespective of its Side and Size
Disclaimer:
3+ Years Teaching Experience in Stock Market - Technical Analysis, Behaviour Analysis, Advanced Patterns, Emotional Management, News based Trading...
We are NOT SEBI Registered and Our focus is NOT providing Buy/Sell Recommendations/calls. Primary Objective is to provide detailed analysis of how to review a chart, explain multi-timeframe views purely for Educational Purposes.
We strongly suggest our followers to "Learn to Ride the Tide irrespective of its Side"
*** Important *** Consult your Financial Advisors before taking any positions
If you like our detailed analysis, please do rate us with your Likes, Boost and share your comments
-Team Stocks-n-Trends

Vodafone Idea Cup with handle breakout on monthly chartsvodafone idea is making a Cup with Hndle pattern on monthly time frame with breakout

vodafone idea chart analysisvodafone idea chart analysis on daily time frame. Please share your valuable feedback

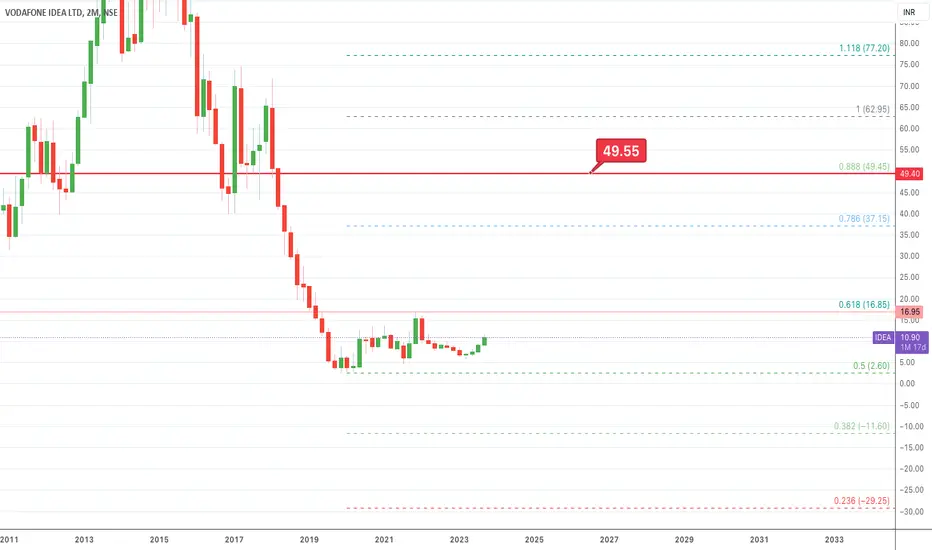
IDEA: Long term multi bagger 5x?Looks like Idea will test 49 in the longer term max 7 years, i.e almost 5x returns from the current market price
Target: 49
Immediate Resistance: 16.85
Lets see what happens
Vodafone Idea for longVodafone idea is looking good now to enter, broke a very important level of 18 with a box breakout after a long consolidation. Given a number of big announcements underway it looks ready to attract new investors.
Holding period minimum 1 Year
Note: Please consult your financial advisor before making any investments. This idea is only for educational puspose.

VI Cup with Handle pattern Vi is making perfect cup with handle pattern if can sustain above 18.50 levels it can go upto 25+ levels.

Short to LongIDEA has expanded to a significant area of price defined as a volume imbalance. We had a good reaction. I believe we will sell into the marked bullish volume imbalance. I am still cautious of longs because the lows of the chop have bee retained. If this drive higher had been after taking the eqwl lows marked it would have been an excellent buy.

Slightly modified AnalysisI would like to see price dip under the equal lows to bite a little deeper into the weekly +OB.

#IDEA long trade setup intraday (09/05/24)Greetings Folks,
today I have prepared a setup of
NSE:IDEA on NSE
the analysis is as follows-
- marked an important support zone in higher timeframe
- price tapped in it and respected the support zone
- in lower timeframe , there is a ranged structure
speculating that nifty might move in up direction, we can plan a small counter trade
don't play with fire, always use a predefined stoploss

Accumulation Levels for IDEAIDEA has reached very lucrative levels for Long term investing.
Bounced off near Anchored VWAP which should act as short term support.
Stop loss is weekly close below 11.20 fib zone

IDEA choppy PA range bound.I would like to see price drop without attacking the lows of the current range. I would then expect a drive higher. But low probability to me.

Idea coul be turned multibagger and become 59 in Few yearsIt's important to approach risky trades with caution and thorough analysis. Here's a recommendation for Vodafone Idea considering your specified parameters:
**Recommendation: Vodafone Idea**
- **Entry Price:** Current Market Price (CMP)
- **Stop-loss (SL):** Below 10
- **Targets:** 30, 59, and 72
**Reasoning:**
1. **FPO Launch:** Vodafone Idea's Follow-on Public Offering (FPO) could potentially attract investor interest and lead to short-term price movements.
2. **Potential Multibagger:** If the FPO is successful and positively impacts the company's financials and market sentiment, there might be a possibility of substantial price appreciation (multibagger potential).
**Risk Factors to Consider:**
1. **Volatility:** Vodafone Idea stock has historically shown high volatility, so it's crucial to be prepared for rapid price fluctuations.
2. **Company Performance:** Assess the company's financial health, debt levels, market position, and regulatory environment before making investment decisions.
3. **Market Conditions:** Consider broader market trends, sectoral performance, and geopolitical factors that could influence the telecom industry and Vodafone Idea specifically.
4. **Liquidity:** Note that stocks with low prices (below 10) can have lower liquidity and higher bid-ask spreads, impacting trade execution.
**Trade Strategy:**
- **Entry:** Enter the trade at or near the current market price (CMP).
- **Stop-loss (SL):** Set a stop-loss below 10 to limit potential losses in case the trade goes against expectations.
- **Targets:** Consider staggered profit-taking at targets of 30, 59, and 72. This allows for locking in profits at different price levels as the trade progresses.
**Final Note:**
Risky trades, especially in volatile stocks like Vodafone Idea, require diligent monitoring, risk management, and continuous evaluation of market dynamics. Consider consulting with a financial advisor or conducting further research before executing the trade.

Looking for longs into suspect highs for a swing trade.Idea have reached significant lows and has been showing bullish price action based on #ICT. I would look for a suitable place to enter based on an hourly chart for exits at 50 % of the range and then full exit at the highs.
