IGL trade ideas


IGL@bullishIGL had bounceback from it's major support level@430 and has given 2nd close@442, 12 points above this level but 1 point lower than previous day close, alo weekly closing is less than previous week close. Need to watch next week Monday moments, safest longside enty is above 455.
Buy Side Entry point:445
TG1:466 TG2:477 TG3:488 TG4:499 TG5:510 TG6:521
Sell Side Entry point:434.5
TG1:424 TG2:413 TG3:404 TG4:394 TG5:384 TG6:374
Disclaimer: This is for educational purpose only, consult your financial advisor before taking trade.


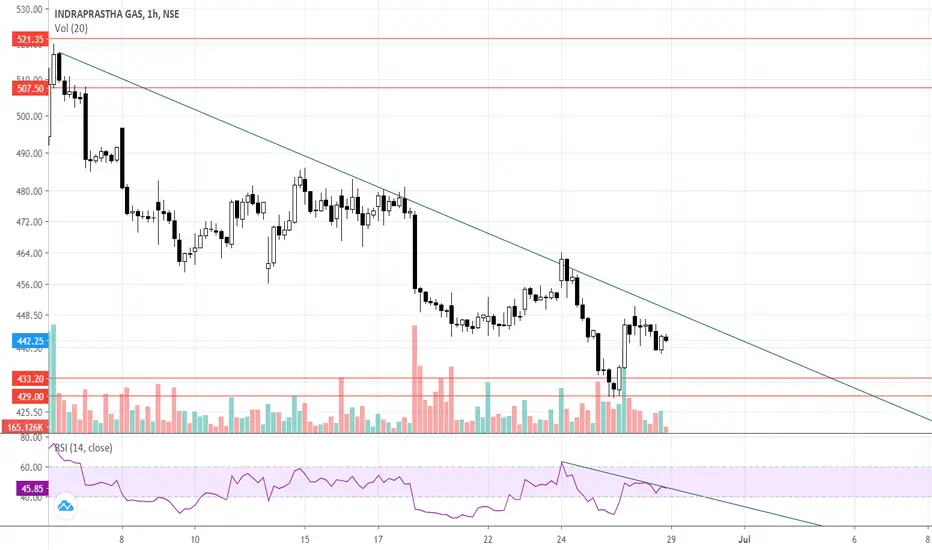
IGL breakout from falling wedge IGL has been contracting its movement in falling wedge pattern in 60 mins chart. waiting for the breakout.

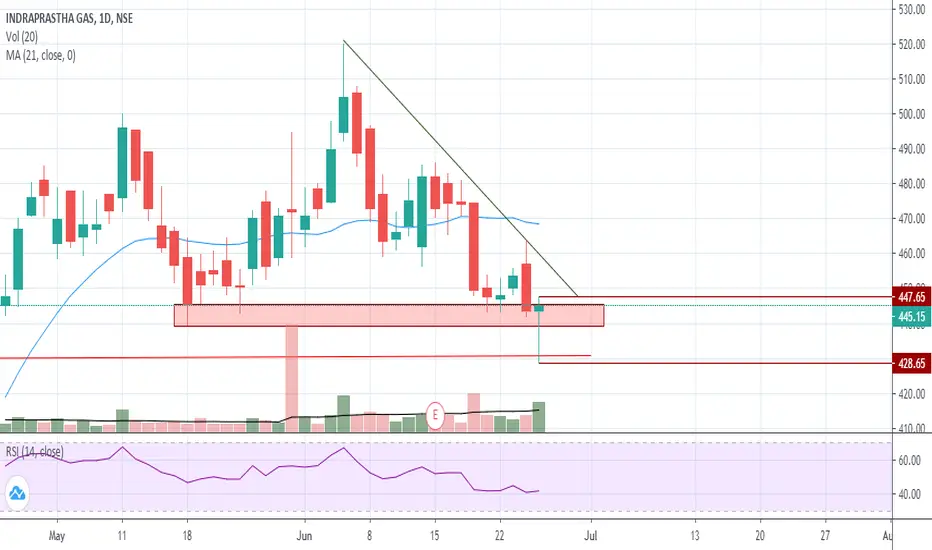
IGLIt has bounced from it support and way back broken another resistance, and is now heading towards 463.
Its a long with a sl of 442.50 for a target of 454 and 463.


IGL Long Above 455 . 15 Min Analysis On Higher time frame its in Up Trend .
On Daily Support Levels .
15 Min Showing Strong RSI Divergence .
For Aggressive Buy Above 450 With Sl of 442 , Target :-460
For Conventional :- buy above 455 , sl :- 439 , target :- 469-474


IGL in Chaneel#IGL : In this chart, the green color channel refer day and blue color refer 1hr channel and Harmonic (Gartley Pattern)
As per the Daily channel pattern, it is the bottom of the channel. Now it is testing 6th time. so it is a weaker high probability is it will break the channel.
1hr show it the bottom of the channel and formed a Gartley pattern. chance to move upside. And when it is brokes LH then trend will move upside range.


IGL ShortDeep Crab formed and It fell. Sell was around 501.25 with SL 511.3 Target:495.9,492.15,488.4
Resistance at 498ish.

