INDRAPRASTHA GAS (Positional Trade)POSITIONAL TRADE
INDRAPRASTHA GAS
Looks Good ABOVE 510.70
SL 401.90
Targets 544.30 - 1152.40
Hold few weeks to months
Please consult your financial advisor before investing
All research is for educational purposes only.
IGL trade ideas

IGL ready for a long journyWeekly candle above imoortant resistace, We can buy here, SL will be current month low, Target 1st 580 to 600 , if 600 breakout on monthly candle then we can see big targets.

IGL ready for a long journyWeekly candle above imoortant resistace, We can buy here, SL will be current month low, Target 1st 580 to 600 , if 600 breakout on monthly candle then we can see big targets.

IGL breaking outIGL breaking out of 3 year long trend-line/pennant, 2 year long cup&handle with some good volume.
TP 595/800

MACD Crossover Swing Trade - IGL📊 Script: IGL
📊 Sector: Gas Distribution
📊 Industry: Miscellaneous
⏱️ C.M.P 📑💰- 504
🟢 Target 🎯🏆- 535
⚠️ Stoploss ☠️🚫 - 489
⚠️ Important: Always maintain your Risk & Reward Ratio.
✅Like and follow to never miss a new idea!✅
Disclaimer: I am not SEBI Registered Advisor. My posts are purely for training and educational purposes.
Eat🍜 Sleep😴 TradingView📈 Repeat 🔁
Happy learning with trading. Cheers!🥂


IGL FOR SWING It is a multi-time frame breakout. A good momentum can be expected above 490 with nearest swing as SL in 1day time frame T1 is ALL TIME HIGH T2 is 30% from the breakout. One can hold it till it shows a bearish sign in 1D TF

IGL 1MONTHIT IS READY TO BREEAK OUT
WAIT FOR THE RETEST
I Am Not SEBI Registered Analyst. All Post and Levels Posting is only for educational and knowledge purpose. I Am not responsible for your any kind of loss or profit.
No Claim, All Rights Reserved.‼️

My view on IGLInverse head & shoulder and trendline breakout possible in IGL
Looking tgt 476-478-480++
in very short term👆
Keeping on radar IGL 475 CE

igl 1mtf buy @ 472 target @ 556, 586, 596 symentric triangle igl 1mtf
buy @ 472 target @ 556, 586, 596
symentric triangle breakout
risk reward 1.5
its just a view trade @ your own risk
sl@ 386.75

Crossover - IGL📊 Script: IGL
📊 Sector: Gas Distribution
📊 Industry: Miscellaneous
Key highlights: 💡⚡
📈 Script is trading at upper band of BB.
📈 MACD is giving crossover .
📈 Double Moving Averages giving Crossover.
📈 Right now RSI is around 63.
📈 One can go for Swing Trade.
⏱️ C.M.P 📑💰- 472
🟢 Target 🎯🏆 - 508
⚠️ Stoploss ☠️🚫 - 458
⚠️ Important: Always maintain your Risk & Reward Ratio.
✅Like and follow to never miss a new idea!✅
Disclaimer: I am not SEBI Registered Advisor. My posts are purely for training and educational purposes.
Eat🍜 Sleep😴 TradingView📈 Repeat 🔁
Happy learning with trading. Cheers!🥂


Review and plan for 8th May 2024Nifty future and banknifty future analysis and intraday plan in kannada.
This video is for information/education purpose only. you are 100% responsible for any actions you take by reading/viewing this post.
please consult your financial advisor before taking any action.
----Vinaykumar hiremath, CMT

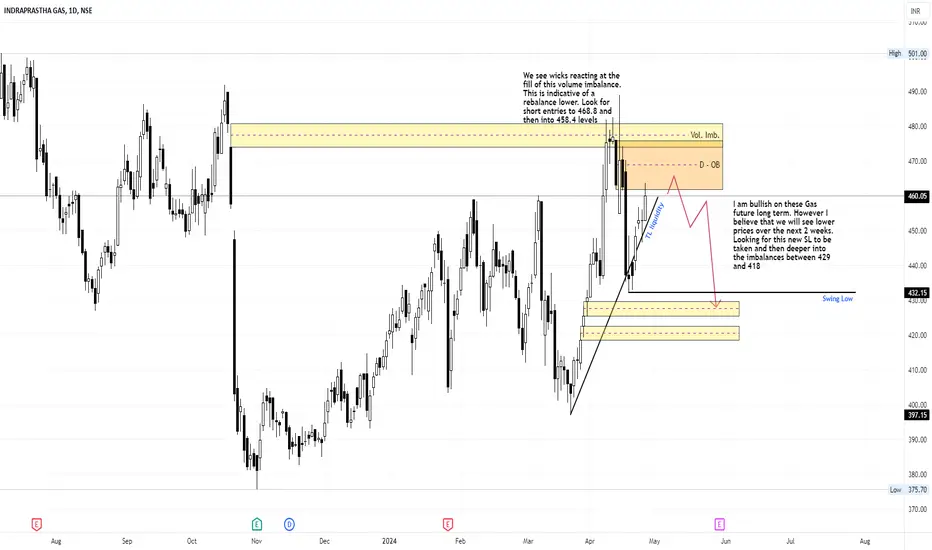
Short OpportunityI am bullish on these Gas future long term. However I believe that we will see lower prices over the next 2 weeks. Looking for this new SL to be taken and then deeper into the imbalances between 429 and 418
breakoutthere is trendline breakout in IGL LTD. Stock pe is 19.3 and roe and roce are above 20% both. oil and gas sector is trending. should be a good buy

IGL...This buy is no gas.Beautiful...trinagle breakout....tgt calculated and mentioned on the chart...on good volumes too...investors too can buy this

INDRAPRASTH GAS AT SUPPORT LEVEL FORMING HAMMER CANDLEIndraprasth gas is on support level and form strong hammer candle yesterday on 1 day time-frame.
It is looking good for short- term bullish momentum.
If high of hammer is break and today candle give strong closing above the high we look it for bullish swing . And target upto 455

IGL will become multibagger after BreakoutIGL may give Huge Breakout !!
IGL is Making Hut pattern after an uptrend
Possibility of Breakout is huge because its a continuation pattern
We may see huge upside after breaking the resistance
If stock comes down we can see support is around 370-390 level
Breakout confirmation is above 480-500
Current price is around 450
Targets are around 900-950 level
Thanks !!
Disclaimer : We are not SEBI registered analyst. Do your own research before taking any investment decision.

EXPENDED FLAT : ELLIOTT WAVE CORRECTIONEXPANDED FLAT CORRECTION
2- EXPANDING FLAT :
• A corrective 3 waves move labelled as ABC
• Subdivision of wave A and B is in 3 waves
• Subdivision of wave C is in 5 waves impulse / diagonal
• Subdivision of wave A and B can be in any corrective 3 waves structure including zigzag, flat, double three, triple three
• Wave B of the 3-3-5 pattern terminates beyond the starting level of wave A
• Wave C ends substantially beyond the ending level of wave A
Fibonacci Ratio Relationship
• Wave B = 123.6% of wave A
• Wave C = 123.6% – 161.8% of wave AB


IGL - Swing or Intraday Levels targets Quick Movement Quick movement can be expected in IGL
Below Targets can be expect in 3-5 days
if IGL day closing on (18th Dec), above 406 then more bullish movement targets 435 or 467.
if IGL day closing )on 18th Dec) Below 405 then more Bearish movement targets 375 or 347 .
Use Proper SL as per your comfort.
Please do your due diligence before trading or investment.
Disclaimer -
I AM NOT A SEBI REGISTERED ANALYST OR ADVISOR. I DOES NOT REPRESENT OR ENDORSE THE ACCURACY OR RELIABILITY OF ANY INFORMATION, CONVERSATION, OR CONTENT. STOCK TRADING IS INHERENTLY RISKY AND THE USERS AGREE TO ASSUME COMPLETE AND FULL RESPONSIBILITY FOR THE OUTCOMES OF ALL TRADING DECISIONS THAT THEY MAKE, INCLUDING BUT NOT LIMITED TO LOSS OF CAPITAL. NONE OF THESE COMMUNICATIONS SHOULD BE CONSTRUED AS AN OFFER TO BUY OR SELL SECURITIES, NOR ADVICE TO DO SO. THE USERS UNDERSTANDS AND ACKNOWLEDGES THAT THERE IS A VERY HIGH RISK INVOLVED IN TRADING SECURITIES. BY USING THIS INFORMATION, THE USER AGREES THAT USE OF THIS INFORMATION IS ENTIRELY AT THEIR OWN RISK.
Thank you.

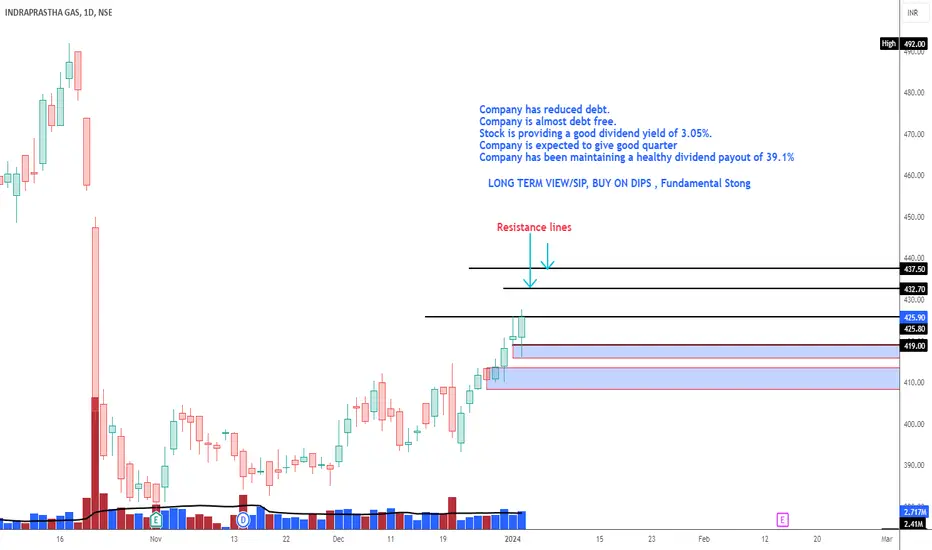
IGLLONG TERM VIEW Company has reduced debt.
Company is almost debt free.
Stock is providing a good dividend yield of 3.05%.
Company is expected to give good quarter
Company has been maintaining a healthy dividend payout of 39.1%