INDRAPRASTHA GAS AT ITS ATH LOOKING GOOD FOR AT LEAST 100 POINTSLooking at Charts its at ATH with Gradually Increasing Volume NSE:IGL from last 3 weeks
NSE:IGL
IGL trade ideas

IGL Reaction from Harmonics FIB 1.414Equation is Long above 580 or short below 560
Above 580 it can go to 1.618 FIB around 600-605.
Below 560, it may go donw till 515-520

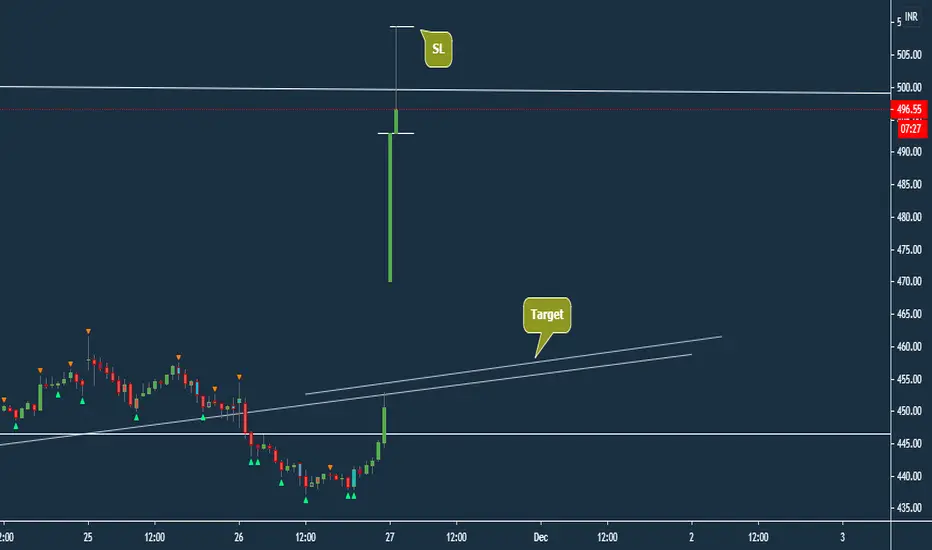
IGL { 30 M Short } This is a channel bet. You can see it's following a pattern under the drawn trend lines , Rest is as per charts
Note :-
Entry - At the break of mentioned candle's low/high
Stop Loss -
In a Short Trade, I always use Previous Candle High ( PCH ) as a stop loss while entering the trade. Sometime I might use 15 M tf SL & trade in 30M tf which I'll mention. Vice Versa for long trades
Trailing Stop Loss ( TSL ) - Mostly I trail stop loss by PCH as price falls . I exit as PCH breaks & vice versa
Use of PSAR as TSL :- TSL get's hit in trend following due to noise, In such cases I use PSAR to be in trend & exit if PSAR direction change
You can use any one of above mentioned or your own way to manage risk
Time Frame :- I take ~ 90% of my intraday trades in 15m tf. Where my analysis might come from higher frames like W , D or 1hr chart pattern which will be mentioned.
Target :- I do set target line based on support / resistance slightly above/ below it . Please pay attention to it

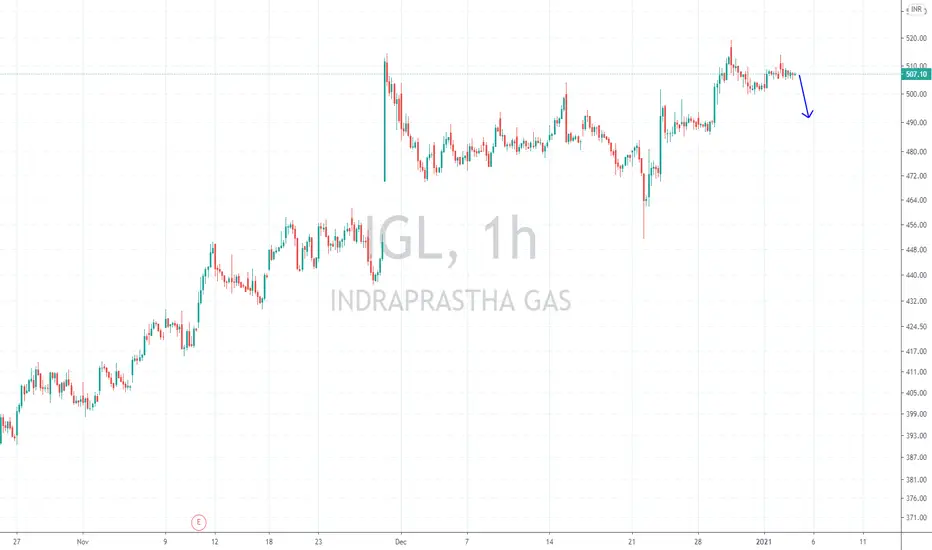
IGL - Intraday Trade SetupIGL CMP - 506.70
Looking bearish in higher time frame. One can go for Intraday Trade setup with the following entry, exit & targets
Sell at or Below 505 / Stop Loss 512
Target 1 - 501
Target 2 - 496
Target 3 - 490
Disclaimer: This is my view and for educational purpose only.
IGL ViewIGL given Breakout in long term chart. Volume is also supporting. Buy on dip. Key level is 488.75, that's already breaked.

IGL - LONG TERM PERSPECTIVE ALL THE LEVELS AND PATTERNS ARE MARKED ON CHART, RED ZONES DENOTES SUPPLY ZONES AND GREEN IS FOR DEMAND ZONE .
The indicator used:
1) Daily Lines plots Daily 20 (BLACK) & 50 EMA (GREY) on lower time frame charts
2) TE-REKAB
- PB : PULLBACK
If you like the analysis, do leave a like and follow for more such content coming up.
The analysis is my POV, hope you got bucks in your pocket to consult a financial advisor before investing :P :)
HAPPY TRADING!!!


IGL - Bearish FlagIGL has bearish flag on hourly chart, But near demand zone, If demand breks then next demand would be target.


IGL - Intraday Trade SetupIGL CMP - 483.15
Looking bearish in higher time frame. One can go for Intraday Trade setup with the following entry, exit & targets
Sell At at Below 478 / Stop Loss 484
Target 1 - 475
Target 2 - 473
Target 3 - 470 / 460
Disclaimer: This is my view and for educational purpose only.

BUY IGL ABOVE 489.40 SL 484 TGT 503today both igl and mgl looks very good . in case of igl buy above 489.40 tgt 503 sl 484.

Cup and Handle formation IGL on weekly chartWait for retracement at 456 and then go long for the target of 650 in 6 months.

IGLI'm not an expert I'm just sharing my views on IGL for next trading day
I'm not responsible for any profit or loss this is not a recommendation.


A GOOD BREAKOUT CHARTIGL LOOKS VERY PROMISING HAS GIVEN A RESISTANCE BREAKOUT ON THE CHART..POSITIVE DIVERGENCE CAN BE SEEN ON RSI..GOOD BET FOR A SWING TRADE..

IGL TRIGGERED AND GAVE 2 % INTRA DAYTRADE BASED ON
1. PRICE ACTION
2. TREND LINE
3. RSI.4.
4. FIBO STRATEGY

Triangle pattern breakout in Day time frame- watchoutTriangle pattern in Day timeframe- IGL — still holds.
Wait for breakout.

IGL - Ready to Break Free...IGL - Ready to Break Free... Let us see ...!
DISC: Not a SEBI Registered. I post charts for my own study.

INDRAPRASTHA GAS 4HRConfluence of Two Strong patterns zones Daily Bat(Red colour)& 4HR Bat ZONE ..
Ultra high volume up bars - trap of Smart Money , Higher volume- Professionals are selling into the public buying
SET UP BECOMES VALID ONLY when RSI is below 70 and IF Price breaks ULTRA HIGH VOLUME Candle LOW with LOW VOLUMES & with NO DEMAND l.e place for short
POTENTIAL SELL

INDRAPRASTHA GAS Daily Bearish BAT
Withiin 3-5 price bars PATTERN need to be get confirmed from a BEARISH CANDLE with Low volumes & RSI Below 70
POTENTIAL SELL


Performance of GAS DistributorsWe can see the Performance of GAS Distributors ADANIGAS & IGL Out Performing.
