IndusInd Bank Bullish Momentum with a Targeted Upside in Sep serIndusInd Bank is showing a strong technical setup, with bullish momentum driving the stock above a key resistance level, backed by high trading volumes. Moving averages are aligned positively, and the RSI is holding above 50, indicating sustained strength. I have bought the IndusInd 1420 CE of September series at ₹33, targeting ₹45-65, with a stop loss set below ₹28. The stock appears well-positioned for further gains, making this an attractive options trade.
INDUSINDBK trade ideas

IndusInd Bank Bullish Momentum with a Targeted Upside in Sep serIndusInd Bank is showing a strong technical setup, with bullish momentum driving the stock above a key resistance level, backed by high trading volumes. Moving averages are aligned positively, and the RSI is holding above 50, indicating sustained strength. I have bought the IndusInd 1420 CE of September series at ₹33, targeting ₹45-65, with a stop loss set below ₹28. The stock appears well-positioned for further gains, making this an attractive options trade.

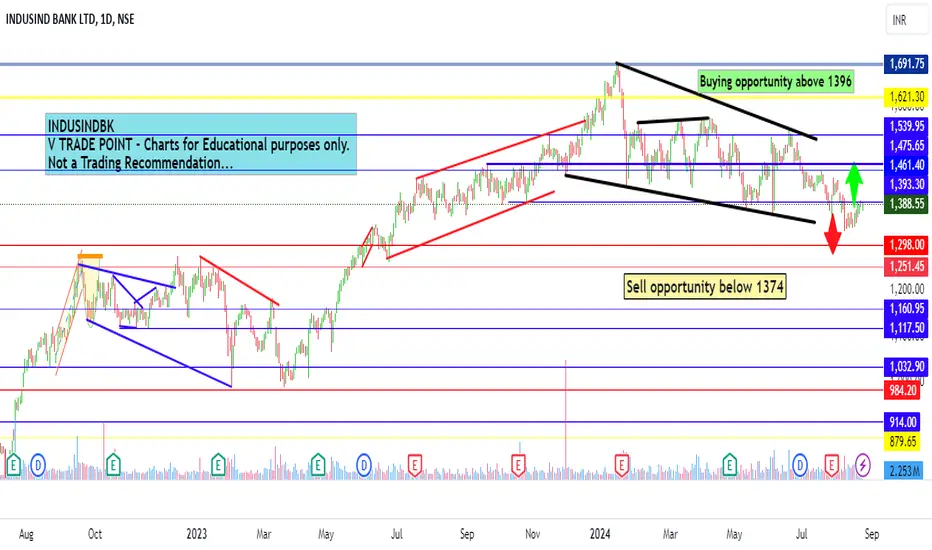
IndusInd Bank Ltd intraday level for 26th Aug #INDUSINDBK IndusInd Bank Ltd intraday level for 26th Aug #INDUSINDBK
Buying may witness above 1396
Support area 1374. Below ignoring buying momentum for intraday
Selling may witness below 1374
Resistance area 1395
Above ignoring selling momentum for intraday
Charts for Educational purposes only.
Please follow strict stop loss and risk reward if you follow the level.
Thanks,
V Trade Point
INDUSIND BANK 1Week TFIndusind bank make Pole and Flage Pattern on weekly chart, entry after breakout and retest.

Long Trade - Indusind BankIndusind Bank received nod from RBI for mutual fund business, will bring positive outcome looking at the money flow in mutual fund industry.
Stock is trading at good support
Buying triggered in private banks, and indusind bank can be big bet in this sector.
Good RR
Read this stock and do your own analysis before taking any trade.

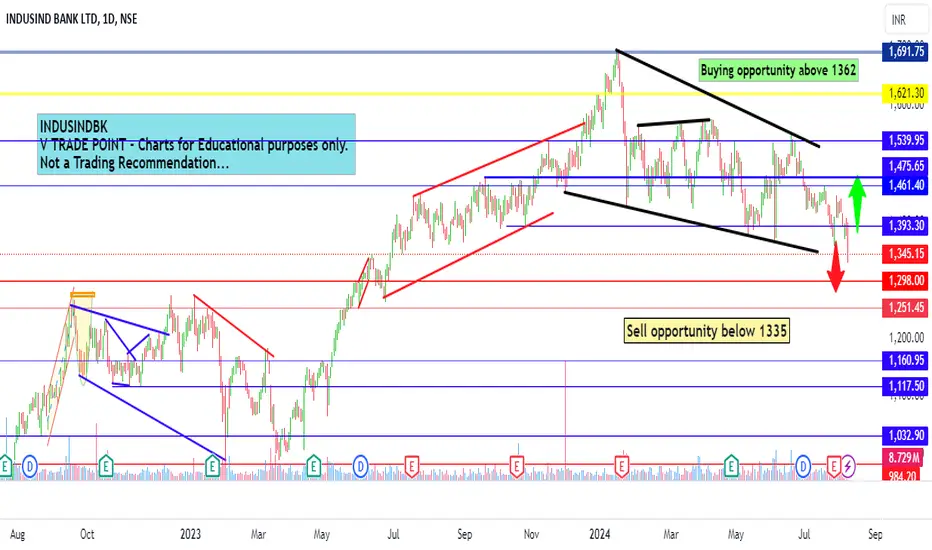
Indusind Bank Ltd intraday level for 8th Aug #INDUSINDBK Indusind Bank Ltd intraday level for 8th Aug #INDUSINDBK
Buying may witness above 1362
Support area 1350. Below ignoring buying momentum for intraday
Selling may witness below 1335
Resistance area 1350. Above ignoring selling momentum for intraday
Charts for Educational purposes only.
Please follow strict stop loss and risk reward if you follow the level.
Thanks,
V Trade Point
buy at zone - swing / intradayENTRY
- lines marked below is potential reversal zone ( PRZ)
- entry is strictly inside the zone
- look for buying confirmation in smaller time frame ( 15 minutes preferred )
EXIT
1. target
- mark fib retracement from C to latest swing low
- TGT 1 - 0.236 fib level ( intraday tgt)
- TGT 2 - 0.382 fib level
- TGT 3 - 0.5 fib level ( preferred target )
2. SL
- candle close below (PRZ)
- if u didn't get confirmation inside the zone , ignore this pick
- if candle close is below zone , this pattern becomes invalid . IGNORE THIS PICK
- RE-ENTRY can be done , if u again get buying confirmation inside the zone

multiple testing of single point we can clearly see that we are testing one single point for the multiple times , along with that
Pole and flag is also seen in the charts
make decision accordingly.
All the best.
Gratify if you appreciate the practice then you can like it, share it and
If you want me to investigate any chart for you then would cherish doing that for you.
Thank you for your time and support.
Stay safe.

INDUSINDBKTaking good support. Wait for the strong close. Pls do your own analysis before entering any trade. Kindly boost the idea if it helps you. Thank you

Indusnd Bank Intraday level for 8th July #INDUSINDBK Indusnd Bank Intraday level for 8th July #INDUSINDBK
Buying opportunity above 1455
Support area 1430-1435. Below ignoring buying opportunity
Selling opportunity above 1428
Resistance area 1450-1455. Above ignoring selling opportunity
Charts for Educational purposes only.
Please follow strict stop loss and risk reward if you follow the level.
Thanks,
V Trade Point

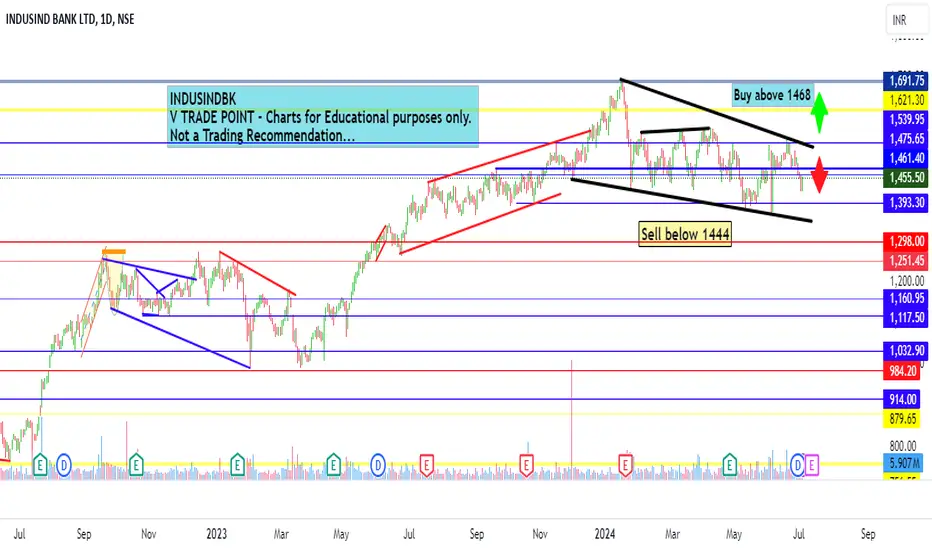
Indusnd Bank Intraday level for 4th July #INDUSINDBK Indusnd Bank Intraday level for 4th July #INDUSINDBK
Buying opportunity above 1468
Stop Loss area 1450
Selling opportunity below 1444
Stop Loss area 1460
Charts for Educational purposes only.
Please follow strict stop loss and risk reward if you follow the level.
Thanks,
V Trade Point
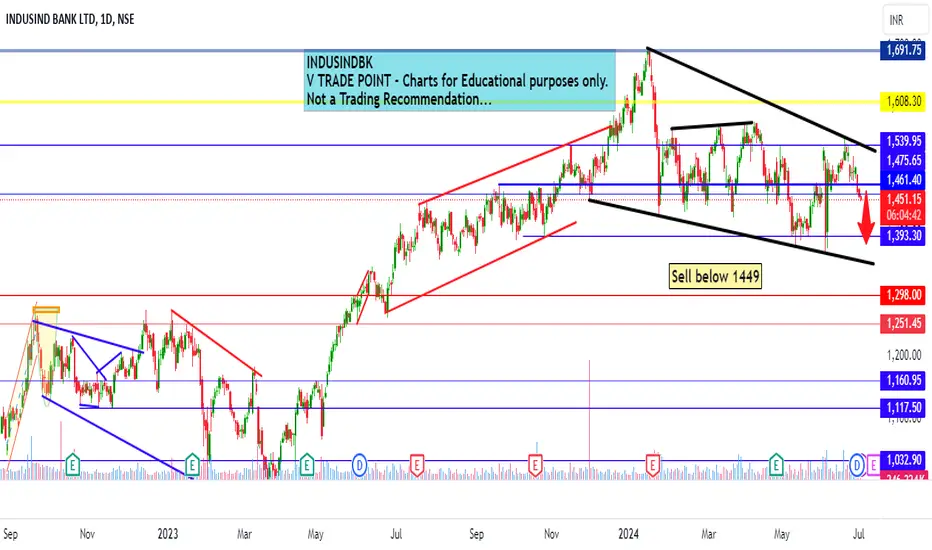
Indusnd bank Intraday level for 2nd July #INDUSINDBKIndusnd bank Intraday level for 2nd July #INDUSINDBK
Selling opportunity below 1449
Stop Loss area 1465
Charts for Educational purposes only.
Please follow strict stop loss and risk reward if you follow the level.
Thanks,
V Trade Point
Indusnd bank Intraday level for 1st July #INDUSINDBK Indusnd bank Intraday level for 1st July #INDUSINDBK
Selling opportunity below 1455
Stop Loss area 1471
Charts for Educational purposes only.
Please follow strict stop loss and risk reward if you follow the level.
Thanks,
V Trade Point

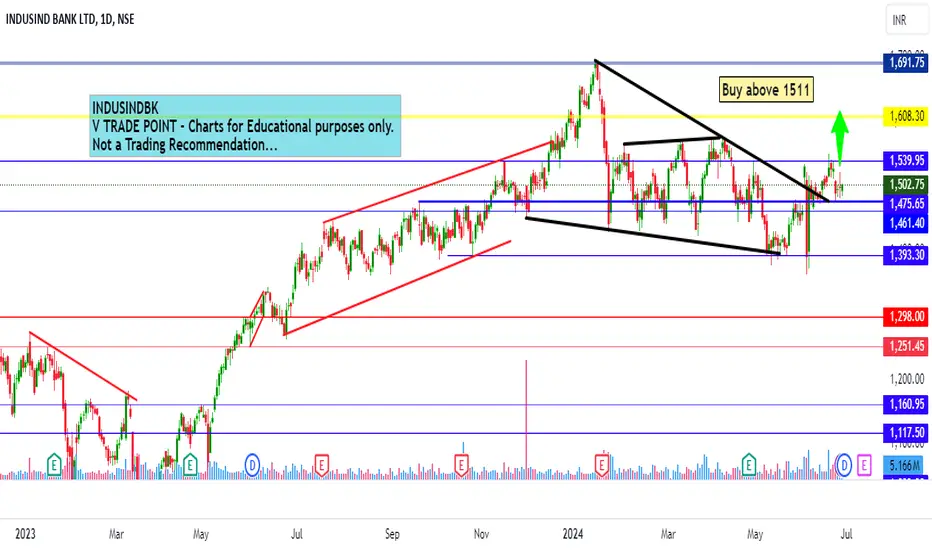
Indusnd bank Intraday level for 28th June #INDUSINDBK Indusnd bank Intraday level for 28th June #INDUSINDBK
Buying opportunity above 1511
Stop Loss area 1500
Charts for Educational purposes only.
Please follow strict stop loss and risk reward if you follow the level.
Thanks,
V Trade Point
IndusInd Bank - A potential upsideTHE TARGET
LTP on NSE on 14/Feb/2024 was INR 1484.50 (with a high of INR 1494.50 and a low of INR 1434.95)
Although it is a good buy at current levels, still conservatively I will accumulate even at dip to Rs.1440/-
Resultantly after all this discussion, I believe that the target price should be:
first INR 2050 and
second INR 2350.
Stop Loss should be INR 1350
Risk to Reward will be 1:9
Time horizon should be 12-15 months

INDUSIND BANK LTD S/R Support and Resistance Levels: In technical analysis, support and resistance levels are significant price levels where buying or selling interest tends to be strong. They are identified based on previous price levels where the price has shown a tendency to reverse or find support.
Support levels are represented by the green line and green shade, indicating areas where buying interest may emerge to prevent further price decline.
Resistance levels are represented by the red line and red shade, indicating areas where selling pressure may arise to prevent further price increases. Traders often consider these levels as potential buying or selling opportunities.
Breakouts: Breakouts occur when the price convincingly moves above a resistance level (red shade) or below a support level (green shade). A bullish breakout above resistance suggests the potential for further price increases, while a bearish breakout below support suggests the potential for further price declines. Traders pay attention to these breakout signals as they may indicate the start of a new trend or significant price movement.
Disclosure: I am not SEBI registered. The information provided here is for learning purposes only and should not be interpreted as financial advice. It is important to consult with a qualified financial advisor before making any investment decisions. Tweets neither advice nor endorsement.
Indusind Bank Elliot Wave Analysis #elliotwave #indusindIndusind bank elliot wave analysis daily time . this stock complete down side correction . Wave A,B or C . Wave C internal 1,2,3,4 or 5 . 2 or 4 trendline breakout

Swing trading idea in indusind bank Swing trading idea in indusind bank as you the chart indusind bank came to the low of 2023 and formed hammer candle in weekly timeframe we can plan buying at this level

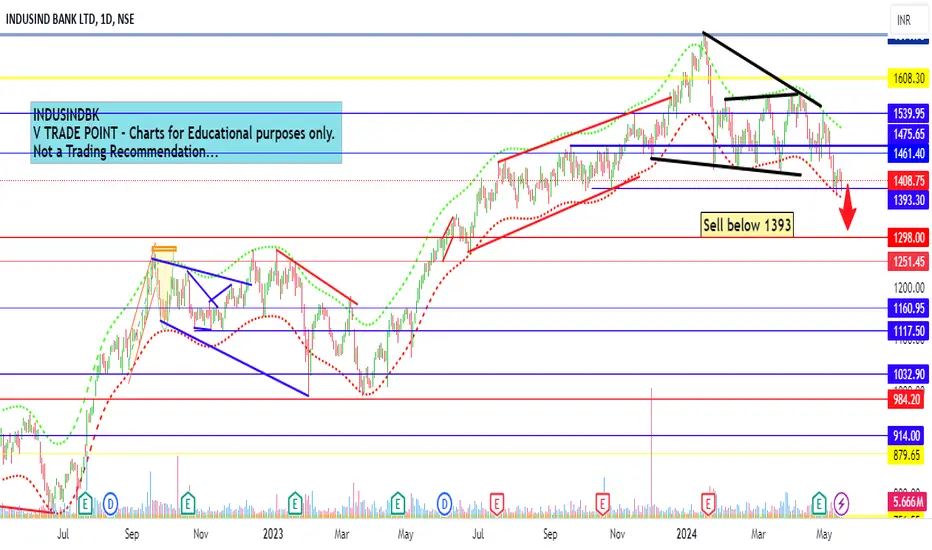
Indusind bank view for tomorrow 17th May Indusind bank view for tomorrow 17th May
Buying opportunity only above if sustain above 1420
Selling chance below 1393
Charts for Educational purposes only. Not a Trading Recommendation
Strictly follow Risk Reward and Stop Loss
Thanks,
V Trade Point
INDUSINDBK Analysis for Swing and Intraday for 29 AprilCreate a high of 1694 the price is moving in a range between 1579.20-1428.Price can take Support at range between 1428 -1443. Because 5 times price respect this level .
For swing trader we will wait for breakout or breakdown.
Bull Entry: after cross 1576 level with good volume and day closing.
If you are looking for intraday :
After crossing 1442 level you can short your position and next support will be 1272.
If price trade between 1450-1480 it's a side base market. if price cross above 1480 level with good volume or with price action then we can make a target of 1511.
Important level:
Resistance 1576
Support 1: 1448
Support 2: 1272.60

Indusind bank Indusind Bank has cup & handle pattern, you can buy from 1570, stop loss will be 1530 and target will be 1640.

INDUSINDBK Looking for BullishStock name - INDUSIND BANK
Daily chart setup
Chart is self explanatory. Levels of breakout, possible up-moves are clearly defined. Buy after breakout confirmation
Do Like ,Comment , Follow for regular Updates...
Disclaimer: This is for demonstration and educational purpose only. this is not buying and selling recommendations. I am not SEBI registered. please consult your financial advisor before taking any trade.
