50 SMA Rising - Positional TradeDisclaimer: I am not a Sebi registered adviser.
This Idea is publish purely for educational purpose only before investing in any stocks please take advise from your financial adviser.
Its 50 SMA Rising Strategy. Suitable for Positional Trading Initial Stop loss lowest of last 2 candles and keep trailing with 50 days SMA if price close below 50 SMA then Exit or be in the trade some time trade can go for several months.
Be Discipline because discipline is the Key to Success in the STOCK Market.
Trade What you see not what you Think
INFY trade ideas

Infosys longInfosys
MTF Analysis
Infosys Yearly Demand DMIP WIP 1620
Infosys 6 Month Demand DMIP WIP 1730
Infosys Qtrly Demand WIP 1730
Infosys Monthly Demand Breakout 1730
Infosys Weekly Demand DMIP 1797
Infosys 240 m dmip 1888
ENTRY -1 1893
ENTRY -2 1797
Entry Avg 1893
SL 1849
RISK 44
Target 2150
REWARD POINT 257
Last High 1975
RR 5.84
RR 14%


INFYHi guys,
In this chart i Found a Demand Zone in INFY CHART for Positional entry,
Observed these Levels based on price action and Demand & Supply.
*Don't Take any trades based on this Picture.
... because this chart is for educational purpose only not for Buy or Sell Recommendation..
Thank you

INFY S/R for 9/9/24Support and Resistance Levels:
Support Levels: These are price points (green line/shade) where a downward trend may be halted due to a concentration of buying interest. Imagine them as a safety net where buyers step in, preventing further decline.
Resistance Levels: Conversely, resistance levels (red line/shade) are where upward trends might stall due to increased selling interest. They act like a ceiling where sellers come in to push prices down.
Breakouts:
Bullish Breakout: When the price moves above resistance, it often indicates strong buying interest and the potential for a continued uptrend. Traders may view this as a signal to buy or hold.
Bearish Breakout: When the price falls below support, it can signal strong selling interest and the potential for a continued downtrend. Traders might see this as a cue to sell or avoid buying.
20 EMA (Exponential Moving Average):
Above 20 EMA: If the stock price is above the 20 EMA, it suggests a potential uptrend or bullish momentum.
Below 20 EMA: If the stock price is below the 20 EMA, it indicates a potential downtrend or bearish momentum.
Trendline: A trendline is a straight line drawn on a chart to represent the general direction of a data point set.
Uptrend Line: Drawn by connecting the lows in an upward trend. Indicates that the price is moving higher over time. Acts as a support level, where prices tend to bounce upward.
Downtrend Line: Drawn by connecting the highs in a downward trend. Indicates that the price is moving lower over time. It acts as a resistance level, where prices tend to drop.
RSI: RSI readings greater than the 70 level are overbought territory, and RSI readings lower than the 30 level are considered oversold territory.
Combining RSI with Support and Resistance:
Support Level: This is a price level where a stock tends to find buying interest, preventing it from falling further. If RSI is showing an oversold condition (below 30) and the price is near or at a strong support level, it could be a good buy signal.
Resistance Level: This is a price level where a stock tends to find selling interest, preventing it from rising further. If RSI is showing an overbought condition (above 70) and the price is near or at a strong resistance level, it could be a signal to sell or short the asset.
Disclaimer:
I am not a SEBI registered. The information provided here is for learning purposes only and should not be interpreted as financial advice. Consider the broader market context and consult with a qualified financial advisor before making investment decisions.

Elliott Wave Analysis of Infosys MonthlyElliott Wave Analysis Overview:
1. Primary Degree Wave 1 (Completed in March 2000):
Price Level: 218
The first primary degree wave, which marked the beginning of a larger uptrend, concluded at the price level of 218.
2. Primary Degree Wave 2 (Completed in September 2001):
Price Level: 33
The corrective wave 2 retraced the gains of wave 1, with the price dropping to 33 before setting the stage for the next uptrend.
3. Intermediate Degree Wave 1 (Completed in January 2002):
Price Level: 76
This wave, part of the larger primary degree uptrend, reached a high of 76.
4. Intermediate Degree Wave 2 (Completed in April 2003):
Price Level: 36
The second intermediate degree wave provided a correction, retracing the advance of wave 1 and concluding at a price of 36.
5. Intermediate Degree Wave 3 (Completed in December 2021):
Price Level: 1953
Wave 3, characterized by its strong momentum, concluded at 1953, marking a significant uptrend in the stock's price.
6. Intermediate Degree Wave 4 (Completed in April 2023):
Price Level: 1185
The corrective wave 4 retraced some of the gains from wave 3, with the price level dropping to 1185.
7. Current Wave Analysis:
Wave 5 of Intermediate Degree:
The ongoing wave 5 of the intermediate degree is in progress.
Target Price for Wave 5: 2380
This wave is expected to complete the intermediate degree cycle and also mark the conclusion of wave 3 at the primary degree.
Summary:
Infosys has undergone a series of significant Elliott Wave patterns since the completion of its primary degree wave 1 in March 2000. The analysis suggests that the ongoing intermediate degree wave 5 could potentially reach a target price of 2380. This target also aligns with the conclusion of the primary degree wave 3. Investors should monitor the price action closely to confirm the completion of wave 5 and assess the potential implications for future waves.
Note: As with any technical analysis, this interpretation is subject to change based on new market data and evolving conditions.
Disclaimer: This analysis is based on historical price data and Elliott Wave principles. Market conditions and price movements can be highly unpredictable. The information provided is for educational purposes only and should not be construed as financial advice. Always conduct your own research or consult with a professional financial advisor before making investment decisions.

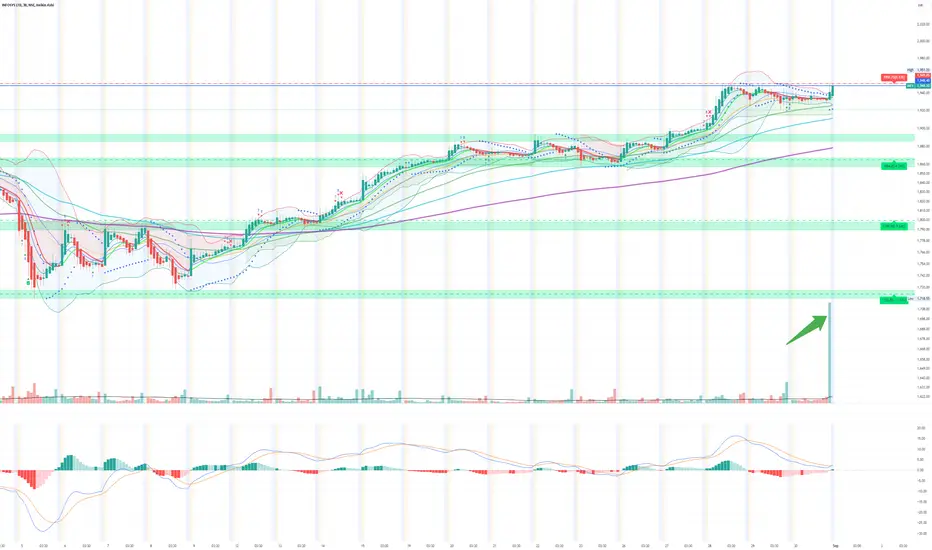
INFY: Bull Ride Begins! Breakout Signals Strong Uptrend
Breakout Level: Above ₹1,951.30 - Confirmed
Support Level: Previous resistance at ₹1,902.55 now acting as strong support
Trend: Ascending trend line indicating continued upward momentum
Action: Monitor closely as the stock shows strong bullish signs

INFOSYS LONGInfosys Month demand 1493: Its a DMIP Zone advance PAT
Infosys Weekly demand 1897: Its BUFL Zone advance PAT
Infosys Weekly demand 1793: Its a DMIP Zone advance PAT
Target 2150

Infosys : Multi Month Breakout PossibleInfosys have made a perfect pattern of cup with handle. Minimum upside from this level is 10%.
Buying Range : 1951-1955
Target : 2150+
SL : 1880
Risk Reward Ratio = 1:2

INFY ready for the bull run - BREAKOUT SOON!!!Infy in the last 30 mins. Seeing a bull run soon with this kind of volume at the close. It may breakout the 1950 resistance on Monday.
INFY LONG (AGGRESSIVE)Nifty is about to break all time high, also its in uptrend in all time frames. Aggressive entry is combining 125 min level with Daily level.
Take this if price retrace without closing on daily basis above 1954 level , once closed above this level & then retrace only use 125 min.

InfosysInfosys
The IT industry's beautiful script has had corrections of about 14% since its recent peak. This, in my opinion, is an excellent opportunity to invest in this kind of stock.
I've seen that the RSI is oversold relative to its position, and I believe this could be an attempt at a positive retracement (there hasn't been any evidence as of yet). I'm hoping for a bullish retracement in the 1490–1470 region. If it crosses the 1510 mark, there might be a nice return.
It can potentially reach 1550, 1580, and 1600 above 1510.
Please don't take it personally; the intent is just educational.
Please consult your advisor before to making any investments.

one red candle was going to found ready for it DIsclaimer for it be ready this only for education purpose only take risk own basic so is it not a advice so be not take any action on your own


Darvas Box Strategy - Break out StockDisclaimer: I am Not SEBI Registered adviser, please take advise from your financial adviser before investing in any stocks. Idea here shared is for education purpose only.
Stock has given break out. Buy above high. Keep this stock in watch list.
Buy above the High and do not forget to keep stop loss best suitable for swing trading.
Target and Stop loss Shown on Chart. As stop loss is Big we keep Initial Target Ratio 1:1
Be Discipline, because discipline is the key to Success in Stock Market.
Trade what you See Not what you Think.

INFY LONG Weekly With trend is up, chances are price would go to the extremes hence look for pull back on 4H chart

INFOSYS LTD S/R Support and Resistance Levels:
Support Levels: These are price points (green line/share) where a downward trend may be halted due to a concentration of buying interest. Imagine them as a safety net where buyers step in, preventing further decline.
Resistance Levels: Conversely, resistance levels (red line/shade) are where upward trends might stall due to increased selling interest. They act like a ceiling where sellers come in to push prices down.
Breakouts:
Bullish Breakout: When the price moves above resistance, it often indicates strong buying interest and the potential for a continued uptrend. Traders may view this as a signal to buy or hold.
Bearish Breakout: When the price falls below support, it can signal strong selling interest and the potential for a continued downtrend. Traders might see this as a cue to sell or avoid buying.
20 EMA (Exponential Moving Average):
Above 20 EMA: If the stock price is above the 20 EMA, it suggests a potential uptrend or bullish momentum.
Below 20 EMA: If the stock price is below the 20 EMA, it indicates a potential downtrend or bearish momentum.
Trendline: A trendline is a straight line drawn on a chart to represent the general direction of a data point set.
Uptrend Line: Drawn by connecting the lows in an upward trend. Indicates that the price is moving higher over time. Acts as a support level, where prices tend to bounce upward.
Downtrend Line: Drawn by connecting the highs in a downward trend. Indicates that the price is moving lower over time. It acts as a resistance level, where prices tend to drop.
RSI: RSI readings greater than the 70 level are overbought territory, and RSI readings lower than the 30 level are considered oversold territory.
Combining RSI with Support and Resistance:
Support Level: This is a price level where a stock tends to find buying interest, preventing it from falling further. If RSI is showing an oversold condition (below 30) and the price is near or at a strong support level, it could be a good buy signal.
Resistance Level: This is a price level where a stock tends to find selling interest, preventing it from rising further. If RSI is showing an overbought condition (above 70) and the price is near or at a strong resistance level, it could be a signal to sell or short the asset.
Disclaimer:
I am not a SEBI registered. The information provided here is for learning purposes only and should not be interpreted as financial advice. Consider the broader market context and consult with a qualified financial advisor before making investment decisions.

Infosys-Bullish Swing- Retracement or Pullback?
12.08.2024
Buy 1799
Target 1881
StopLoss 1716
Risk Reward- 1:1
1. Inside bar breakout
2. Rejection from resistance turned to support
3. Lower volumes found in downtrend
4. RSI Reversal with double bottom

INFY looks ready to performSince the Indian economy has grown more than 2 times through the last 4 years, some of the companies still showing the growth potential and INFY is one of them. The price has break the support zone and now testing it. Waiting for the trend continuation. Trade cancellation will occur, when the price didn't manage to stay above the support zone and will fix below it.
DYOR

Infosys - LongNSE:INFY Monthly breakout stock with positive momentum , looks like extremely bullish movements will come soon ....

infy small time bullinfy daily have small double bottom, looking 1880 target in small period, may be in this august expiry it will reach

Infosys Ltd intraday level for 14th Aug #INFY Infosys Ltd intraday level for 14th Aug #INFY
Buying may witness above 1810
Support area 1780. Below ignoring buying momentum for intraday
Selling may witness below 1780
Resistance area 1810 Above ignoring selling momentum for intraday
Charts for Educational purposes only.
Please follow strict stop loss and risk reward if you follow the level.
Thanks,
V Trade Point

Infosys-Nice BreakoutInfosys-Nice Breakout
Capital to be deployed -20k
Investing Price -1785-1797
Breakout Price -1781
Stoploss -1662
Targets -2104-2261
#infosys #StockMarketindia #StockToWatch #StocksInFocus #stockstowatch #StocksToTrade
