INTELLECT: BFSI + IT PlayBFSI sector has been buzzing over the last few months. This company is an IT sector company catering to them. Fundamentally, this is a strong company. Has had a vertical sort of rally in the last 6 weeks or so. Any dip in here will be bought. Nature of the market is mildly bullish with bouts of volatility. Use it to your advantage.
The pivot marked on chart is roughly 7% away from current market price. Look to average out your buy price over the next few weeks and hold till stock is in Stage 2.
INTELLECT trade ideas

It sector turning bullishIT sector stocks are turning bullish and gaining on momentum took an entry on intellect as it near ath and ready to make new ath i am looking for 1:3 here

Intellect Design Arena Climbs Above Key Descending Resistance📊 Technical Analysis: Intellect Design Arena (NSE: INTELLECT)
🧠 Chart Pattern: Descending Resistance Line Breakout
The stock has been facing resistance from a descending trendline connecting multiple lower highs from March 2024 until now.
Recently, the price has closed just above this descending resistance line around the ₹1,020–₹1,030 level, indicating a potential breakout.
🚀 Breakout Details (May 15, 2025):
Close: ₹1,025.65
Day’s Move: +₹49.75 (+5.10%)
Volume: 1.88M — above average, supporting the breakout attempt.
📌 Technical Signals:
A break above the descending trendline resistance signals a possible end to the downtrend.
The increase in volume confirms the breakout attempt is backed by strong buying interest.
The stock has shown strong momentum, climbing steadily from lows near ₹600 earlier in 2025.
🎯 Potential Upside Target:
The breakout opens up room for a move towards previous highs around:
Target 1: ₹1,100
Target 2: ₹1,200+ based on earlier resistance peaks.
🛡️ Support Levels:
Immediate support is expected near the breakout zone around ₹1,000–₹1,020.
Holding above this trendline now turned support would validate the breakout.

Intellect Design Arena LtdAfter 47% correction, Intellect Design Arena Ltd trading in a parallel channel and there is a EMA support. The current price of 670 seems good, but the range of 600 to 550 looks great for adding, stock can achieve new heights in a 1 to 1.5-year duration.

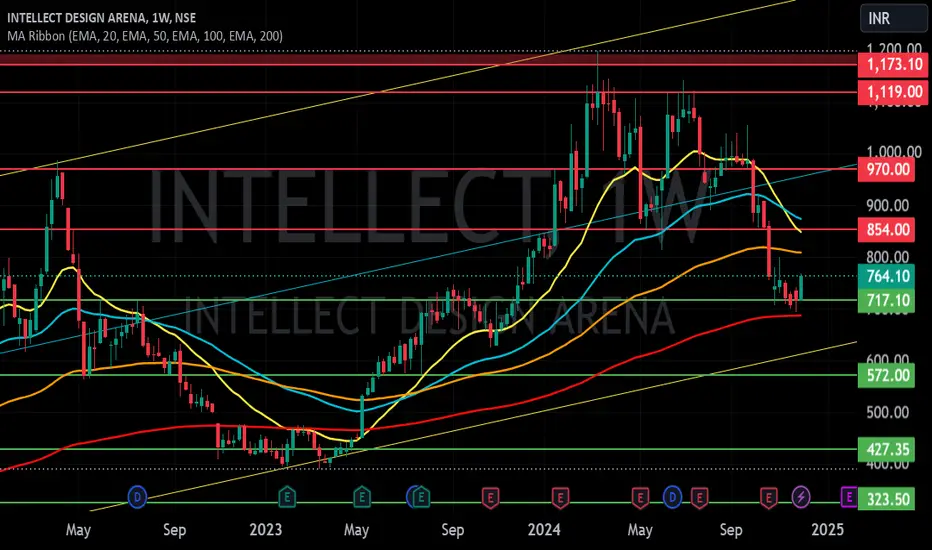
INTELLECT DESIGN ARENA S/RSupport and Resistance Levels:
Support Levels: These are price points (green line/shade) where a downward trend may be halted due to a concentration of buying interest. Imagine them as a safety net where buyers step in, preventing further decline.
Resistance Levels: Conversely, resistance levels (red line/shade) are where upward trends might stall due to increased selling interest. They act like a ceiling where sellers come in to push prices down.
Breakouts:
Bullish Breakout: When the price moves above resistance, it often indicates strong buying interest and the potential for a continued uptrend. Traders may view this as a signal to buy or hold.
Bearish Breakout: When the price falls below support, it can signal strong selling interest and the potential for a continued downtrend. Traders might see this as a cue to sell or avoid buying.
MA Ribbon (EMA 20, EMA 50, EMA 100, EMA 200) :
Above EMA: If the stock price is above the EMA, it suggests a potential uptrend or bullish momentum.
Below EMA: If the stock price is below the EMA, it indicates a potential downtrend or bearish momentum.
Trendline: A trendline is a straight line drawn on a chart to represent the general direction of a data point set.
Uptrend Line: Drawn by connecting the lows in an upward trend. Indicates that the price is moving higher over time. Acts as a support level, where prices tend to bounce upward.
Downtrend Line: Drawn by connecting the highs in a downward trend. Indicates that the price is moving lower over time. It acts as a resistance level, where prices tend to drop.
Disclaimer:
I am not a SEBI registered. The information provided here is for learning purposes only and should not be interpreted as financial advice. Consider the broader market context and consult with a qualified financial advisor before making investment decisions.
Intellect Design ArenaIntellect Design Arena has allotted 89,013 equity shares under ESOP. The paid-up share capital of the Company accordingly increases from Rs. 690,454,895/- divided into 138,090,979 equity shares of Rs. 5/- each to Rs. 690,899,960/- divided into 138,179,992 equity shares of Rs. 5/- each.

INTELLECT INTELLECT Will move 300 points from this 1000 area, stocks is under consolidation will move with good volume. its is a IT company will move from 1000 to 1300/1400 target. making traingle pattern so accumulating this stocks will give good returns

SWING IDEA - INTELLECT DESIGN ARENA Intellect Design Arena , a leading financial technology company, presents a potential swing trading opportunity based on several technical indicators.
Reasons are listed below:
Breakthrough and Retest of Resistance Zone (850-880) : The 850-880 range was a significant resistance zone. The price has broken through this level and is now retesting it, indicating a potential continuation of the upward trend.
Bullish Hammer on Weekly Timeframe : The recent formation of a bullish hammer candle on the weekly chart suggests a potential reversal from the downtrend, indicating strong buying pressure at lower levels.
0.382 Fibonacci Support : The price is finding support at the 0.382 Fibonacci retracement level, a key support zone that suggests the potential for a bounce and continuation of the uptrend.
50 EMA Support on Weekly Timeframe : The stock is trading around the 50-week exponential moving average, providing strong support and indicating a positive long-term trend.
Higher Highs Formation : The stock has been consistently making higher highs, indicating a sustained uptrend and ongoing bullish sentiment.
Gradual Increase in Volumes : There is a noticeable gradual increase in trading volumes, which often confirms the strength of the price move and indicates growing investor interest.
Target - 1100 // 1200
Stoploss - weekly close below 835
DISCLAIMER -
Decisions to buy, sell, hold or trade in securities, commodities and other investments involve risk and are best made based on the advice of qualified financial professionals. Any trading in securities or other investments involves a risk of substantial losses. The practice of "Day Trading" involves particularly high risks and can cause you to lose substantial sums of money. Before undertaking any trading program, you should consult a qualified financial professional. Please consider carefully whether such trading is suitable for you in light of your financial condition and ability to bear financial risks. Under no circumstances shall we be liable for any loss or damage you or anyone else incurs as a result of any trading or investment activity that you or anyone else engages in based on any information or material you receive through TradingView or our services.
@visionary.growth.insights

Will this fill the Gap ?Gratify if you appreciate the practice then you can like it, share it and
If you want me to investigate any chart for you then would cherish doing that for you.
Thank you for your time and support.
Stay safe.

Intellect : Round Bottom trendIntellect :
Strong move after round bottom every time
expecting the same to continue, let's see

Intellect Design Arena Ltd Look Stong Above 955 Intellect Design Arena Ltd Look Stong Above 955
Buy Above 955
Stop Loss 840
Target Near 1100
Holding 2-3 Month
Disclosure : I am not SEBI registered.The information provided here is for education purposes only.I will not be responsible for any of your profit/loss with this channel suggestions.Consult your financial advisor before taking any decisions.


💥Intellect Design Arena💥-Nice Breakout💥Intellect Design Arena💥-Nice Breakout
Capital to be deployed- 20k
Investing Price-770-775
Breakout Price-764
Stoploss-613
Targets-1080-2164
RT for max reach
#intellect #stockstowatch #StocksToBuy #StocksInFocus #stocks #StockMarket

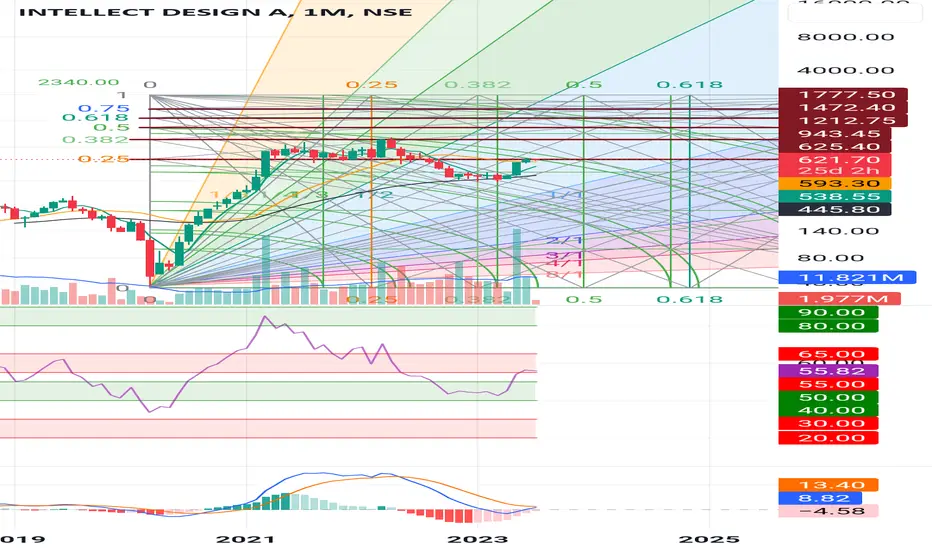
Buy intellect at 730-740 target 3000 in 1-2 yearIntellect design formed a perfect cup and handle on 2 year chart .
we can see a clear breakout and pullback.
lopw risk high reward setup.

Intellect design for buy Intellect design
Is Making buy side design
If you want to buy tips for short positional trades
Contact me
8200694352

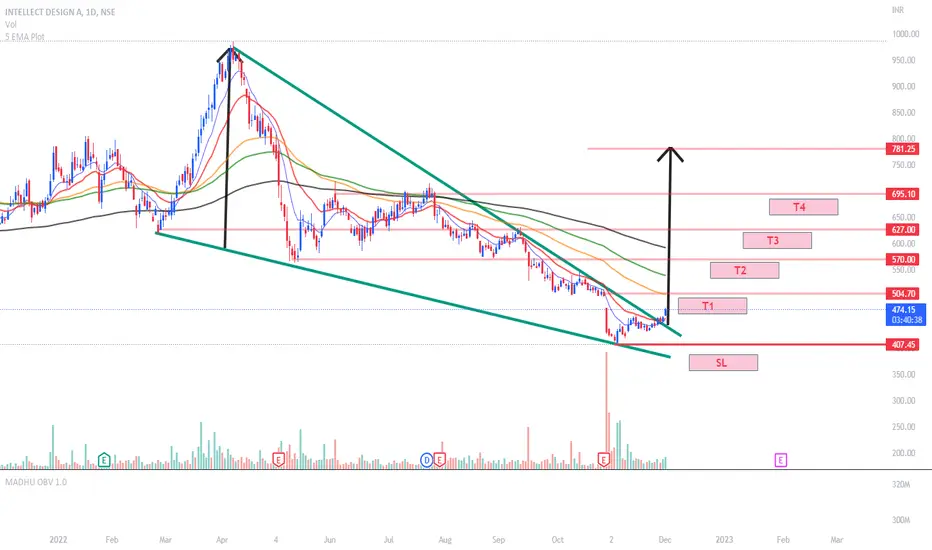
A PERFECT SETUP Script name: Intellect design Ltd.
Cmp 678
Add more if comes around 640-650
TGT 1000+
Sl below 550 ( Jarurat nhe padege vaise to - Pher b le lo )
Some promising point to look at :
- P/E ratio of 34 w.r.t. industry P/E ratio of 55
- Debt to equity ratio of 0.01
- Revenue n profit increasing quarterly
- FII increasing stake quarterly
- Decreasing Public holdings
Note : It's my personal view not any personal recommendation for the buying or selling the mentioned stock.. it's just for educational purpose and chart learning..
Any questions do dm me please

#intellectdesign - Beautiful chart RR 1:5What a beautiful chart
- Perfect example of Fib,
- Volumes
- Support & resistance
PS : Only for learning purpose. Please consult your financial advisor before investing

Intellect DesignPerfect setup for a good rally
12 months of uptrens followed by 12 months of consolidation followed by 12 months of downtrend ann now going for reversal
Good and safe entry above 625( on closing basis of any major time frame)
Intellect Design ArenaCompany works globally in the fields of Financial Technology for Banking, Insurance and other Financial Services.
The company has a comprehensive portfolio of products across Global Consumer Banking, Central Banking, Risk & Treasury Management, Global Transaction Banking and Insurance and is also engaged in the business of software development.
SUGGESTED FOR LONG TERM - WITH SL MENTIONED IN CHART
FOR SHORT TERM T1 , T2 only
Market Cap
₹ 6,388 Cr.
Stock P/E
20.6
Book Value
₹ 136
Dividend Yield
0.53 %
ROCE
24.8 %
ROE
21.3 %
Promoter holding
30.7 %
EPS last year
₹ 25.9
EPS latest quarter
₹ 3.38
Debt
₹ 18.6 Cr.
Pledged percentage
0.00 %
Net CF
₹ 1.44 Cr.
Price to Cash Flow
14.1
Free Cash Flow
₹ 334 Cr.
Debt to equity
0.01
OPM last year
25.3 %
OPM 5Year
15.4 %
Reserves
₹ 1,769 Cr.
Price to book value
3.44
Int Coverage
98.7
PEG Ratio
0.32
Swing trade in Intellect DesignGood buy from this position as trendline support + consolidation.
Targets may go from 557 + , 567+ & 609.
Expecting a good move this week since good volumes + increase in promoter holding!
Lets hope for the best!


Intellect Design Looking back towards golden days.Intellect Design CMP: 531.35
Intellect Design is one of the most comprehensive contextual open finance platform for all corporate banking & consumer banking requirements. It is a Polaris group company which is a world leader in FinTech solutions. The company works on SaaS (Software as a service) products such as virtual accounts, payment solutions, lending solutions, wealth solutions and many more. CMP of Intellect Design is 531.35.
Negative aspects of the company are FIIs decreasing stake & promoters holding decreasing. Positive aspects of the company are improving annual net profits, low debt, improving cash from operations annual, zero promoter pledge & MFs are increasing stake.
Entry can be taken in the stock after closing above 537. Targets will be 574 and 619. Long term targets will be 646 and 700+. Stop loss in the counter should be maintained at 441.

Intellect Design–Range Breakout BullishIn Gujarati “ Bhav is Bhagwan ”
Disclaimer :
I am not a SEBI registered Analyst.
Please do your own Analysis before taking any trade/investment.
The above view is just for educational purpose only.
