IOC trade ideas

IOC On The Way To 100 TargetHello There,
Hope You all are fine and fit..
As you all aware we are sharing daily one stock analysation report here, Same you might book profit from our analysation..
This is short evaluataion For IOC.. Showing very bullish view on chart with all indicator in support, main thing volunme is increased after long time which was the postiive note of this script, we can expect next target with 1-2 week of 100++ Must Hold if it is in holding, we will share next report once it cross 100++ level..
Hope You like our researches and making good profit..
Thanks,
-UD Trade
Desclaimer : This is for educational Perpose We Are Not Sebi Registered You may ask your investment advisor before any action.


Indian Oil Corporation Ltd (IOC - NSE) - stay long Indian Oil Corporation Ltd (IOC - NSE) has completed 2nd wave of C wave within ABC zigzag, so wait for confirmatory 1st wave of 3rd wave cycle, then stay long with stops below 87.30 for target of 103 or higher initially. Very good set up with high volume support.


LONG IOC STOPLOSS 92.55 FOR TARGET OF 96 98 101 103CONTINUATION OF PATTERN, LONG IOC STOP LOSS 92.55 FOR TARGET OF 96 98 101 103


Can we reach on trigger above 90.6 to 99 zones!i m expecting to see strength if 90.6 is triggered rightaway tomorrow!

R-0067 Short Term Cash Buy IOC @ 93 - 93.50 SL 90.70 TGT 98Short Term Cash Buy IOC @ 93 - 93.50 SL 90.70 TGT 98
TK cross over at 87 so not much rally from there on.
MACD indicates bullish momentum

IOC ::: LONG20 JULY 2020
INSTRUMENT: INDIAN OIL CORPORATION.
TIMEFRAME: POSITIONAL.
CHART ANALYSIS: INDIAN OIL CORPORATION HAS A HAMMER FORMATION ON 16 JULY 2020 AND 17 JULY CONFIRMED A BULLISH SIGNAL.
INDIAN OIL CORPORATION IS IN SIDEWAYS FROM 01 JUNE 2020 AND IS STILL WITHIN THE RANGE IT HAS BEEN IN A PRICE RANGE 91.90 TO 83.80.
TRADE IDEA: BUY ABOVE 94.90
INDIAN OIL CORPORATION FACES RESISTANCE AT 100.15 AND 128.10
THIS IS A POSITIONAL TRADE.
RISK DISCLOSURE :
Technical analysis of FOREX and INDIAN MARKETS. We are not SEBI REGISTERED ANALYSTS The views expressed here are for our record purposes only. Please consult your personal financial advisor before investing. We are in no way responsible for your profits/losses what so ever.

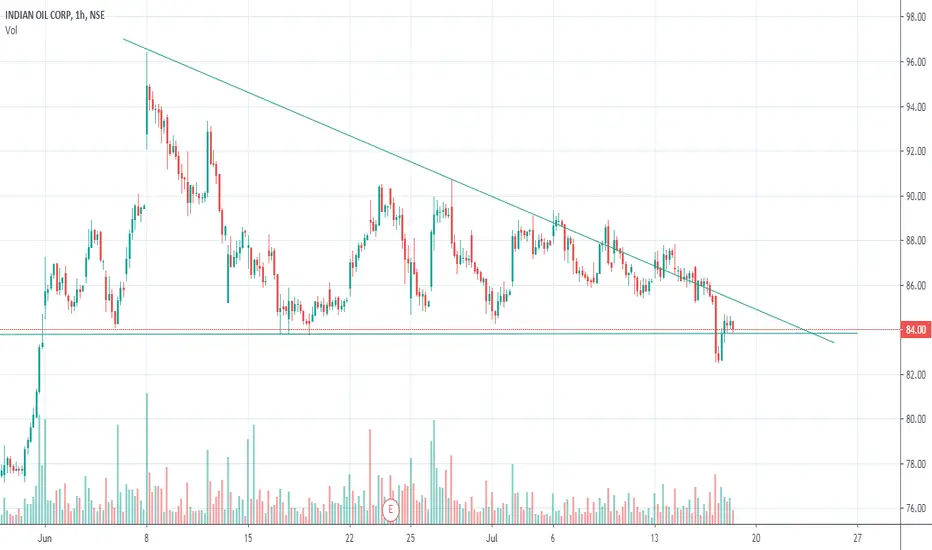
IOCNSE:IOC
Keep a watch on this one, its acting stubborn, tried to break its support 83.50 and reversed above it, if it manages to break it ll show a downside till 78.
**********************************************************************************************************************************************
Hi all,
Its pleasure to have you all here.
I have started putting these charts as a contribution from my side to all people who are new to business, as I had to struggle a lot without any sources at disposal. So please consider this a just small contribution from my side.
Few Honest Disclosures:
1. Any idea shared is my personal view, its not a recommendation, neither any kind of paid propaganda, so please
do your bit of research.
2. Ideas shared does not mean that I trade all or have position in them, this is just a helping hand to all.
3. I expect no comments or like nor any negativity, as I said its just a small helping hand from my side, please plan your risk and trade as per your capacity.
4. To trade in Cash, options or futures is your sole choice and your own risk
5. I am no expert in Tech Indicators, I believe in support resistance and trendline theory, you may use this as a supplement theory for better results.
6. I work for my own living, this is a hobby which I do sincerely to help anyone who might come across my charts.
***********************************************************************************************************************************************
buy IOC for long call time scale 5 daysLONG IOC FOR AT CURRENT PRICE FROM 87 TO 87.50 FOR TARGET OF 94 & 96

IOC short position IOC Short position Below 84.30 target Below side 80-77-75
IOC Only for Buy Above 88.5 target 90-92-95 trade with given level.

Break evident in IOCLIOCL is at good level forming triangle pttern and consolidating at that level. Keep an eye for breakout. The candle is bearish but it will show a breakout I believe. Just keep an eye.


IOC & FIBOThis is a perfect stock that respects fibonacci retracement levels. 90 is a very strong resistance and all the fibo levels are respected greatly and hence I feel that its good to stay away until breakout happens.


IOCAbout to test its support at 83.75 to 83.30, if fails that then heading for 78.75, which is more than 5% fall.
