IOC-SHORTTraders can consider short positions on a confirmation from order flow with appropriate risk management strategies.
IOC trade ideas

IOC LONGIOC on Daily Demand 165-160 Level Target 250
6 Month DEmand Level 135 & BUFL
3 Month demand level 135 & BUFL
Yearly Trend up

#IOC ready for breakoutIndian Oil Corporation Limited looks ready for breakout. As of now, stock has been under consolidation just above Previous ATH levels and forming a bullish MA formation along with nice volume breakout.
SL can be of 5% (candle closing basis) with targets of ₹217 levels.
First target can be of ₹196.
Do your own research before investing as this is just the stock idea that I am sharing.

IOC 2nd impulse wave about to startIOC forming flag after a bullish impulse. Dividend date near.
TP: 260

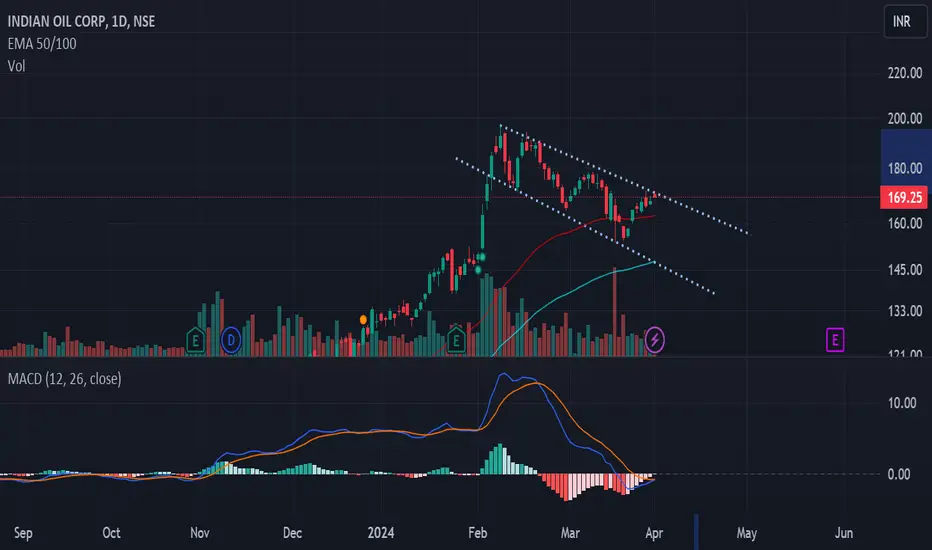
Indian Oil Corporation LtdIOC at the trendline resistance level. From Feb, 24 going in a downward channel.
Watch out for a breakout.

IOC on the Fresh Breakout Level for new highsGood Morning Everyone,
Here we can witness the fresh breakout on trendline where IOC can try to approach his life time high level again @ 196 level. Consider the following levels now:
Breakout - 171
1st Target - 196
2nd Target - 220
Stoploss - 153
NOTE : Please consult your financial advisor before taking any trade on this recommendation

IOC - Indian Oil Corp - An Opportunity to Buy & HoldIOC Technical Analysis Summary - Based on various sources, the technical analysis of IOC is currently mixed
Indicators: Some indicators suggest a bearish trend, while others are neutral. There have been recent bearish signals including a price drop, a bearish crossover on the MACD, and overbought indicators falling back down.
Overall Ratings: At present I will give a neutral technical rating for IOC, although the 1-month rating shows a buy signal.
Moving Averages: Mixed signals, with some suggesting sell and others buy.
Important to Remember:
Technical analysis is not a perfect science and should only be used as one factor in making investment decisions.
Market conditions can change rapidly, so it's important to stay up-to-date on the latest news and analysis.
Consider fundamental analysis, which looks at the company's financial health and future prospects, alongside technical analysis.
IOC Support and Resistance Levels :- Here's a breakdown of recent support and resistance levels for IOC
Support Levels:
S1: 161.1
S2: 158.7
S3: 155.2
100-Day Moving Average: 158.5 (approx)
200-Day Moving Average: 141.5 (approx)
Resistance Levels: :-
R1: 167.1
R2: 170.6
R3: ₹173.0
These levels are based on recent price action and may change as the stock price fluctuates.
It's important to consult live charts to see the most up-to-date support and resistance levels.
Remember, support and resistance levels are not guarantees, but they can be helpful indicators of where the stock price might find buyers or sellers.
Do your own research: Technical analysis is just one factor to consider when making investment decisions. You should also consider the company's fundamentals, news, and overall market conditions.
Thanks for your support as always
Disclaimer: I am not a financial advisor and this is not financial advice. Please do your own research before making any investment decisions.

Inverse Head and shoulder ?Educational purpose only
stock has formed inverse H and S pattern on daily time frame
previous trade is still active this gives enough cinfidence to keeo holding
NIFTy is at all time high so trade with SL

IOC - One Cup Leads to Another :)Indian Oil Corporation - Comparison of Monthly Vs Weekly Chart
Monthly: Long Term View
Price Travelling within a Parallel Channel for nearly 3 Decades
Multi-Year Rounding Bottom BO Done above 154 for Target of 260
Weekly: Short Term View
Another Small Rounding Bottom BO which was triggered at 114 for Target of 180
As you can see on the Weekly chart, 180 Target was reached and Price retraced to test the Monthly Rounding Bottom BO zone at 155 and bounced beautifully
Both on Weekly and Monthly, price respected the levels perfectly. Next Target 260
Disclaimer:
3+ Years Teaching Experience in Stock Market - Technical Analysis, Advanced Patterns, Emotional Management, News based Trading...
We are NOT SEBI Registered and Our focus is NOT providing Buy/Sell Recommendations/calls. Primary Objective is to provide detailed analysis of how to review a chart, explain multi-timeframe views purely for Educational Purposes.
We strongly suggest our followers to "Learn to Ride the Tide irrespective of its Side"
*** Important *** Consult your Financial Advisors before taking any positions
If you like our detailed analysis, please do rate us with your Likes, Boost and share your comments
-Team Stocks-n-Trends

IOC Bullish Breakout IdentifiedIdentified a bullish breakout on the flag formed. Here we expect a continuation in the rally back towards the previous high formed close to 192+

Positional trade: Indian Oil corporationWhy
1.higher high pattern
2. Forming bullish flag pattern
3. Retracement seen from level of 198 and took support at near 160. So 160 is crucial for this.
4.due to election ,oil price is stable, after election you might be see multiple hikes. So these companies will benefitted.
5. Trading above all important moving average.
6.fundamental is good.higher divedent paying Co.
7.target 200/ 230 stoposs daily closing below is 160.
8.trade as per risk.
Disclaimer: ideas doesnot advise you to take trade ,it is for training purposes .

BUY SIGNAL FOR POSITIONAL TRADE INDIAN OIL CORPORATIONS
See the chart and understood the facts.
Due to election oil prices are steady, after Election slowly slowly prices will hike. These companies will be benefitted.
Why now: see the chart ,
First ,clearly forming a flag and pattern chart on weekly time frame.
Second , it has been corrected from 198 and formed base at near 160 and multiple time respected.
Third ,trading above all important moving average.
What to do if stoploss hits
Just exit
Disclaimer: it is only educational purposes. Don't take it as any investment idea .we are not sebi registered. I am also learning and earning.

Keep eye on IOCIOC has formed Flag and pole pattern
however MACD showing bearish signal (wait for turn around)
Target 182, 200
SL 3%
GAin upto 15%
Educational purpose only
Upward momentum of 10% -15% in IOC expected on BOSIOC has seen a consolidation on DTF (bullish pennant) after almost a consolidation of more than 60 days. Confirmation to be given on break of structure.
The company has a upwards of 500% increase in EPS QoQ growth for the last 3 quarters and increase in institutional interest.
Good for swing traders. Can expect an upward momentum of a min of 10-15%. Targets plotted on the chart.
Entry - INR 175
SL - (DL)
TSL - According to your risk profile.
Disclaimer: Please be advised that the information provided is not intended as financial advice. It is imperative to conduct thorough research before making any investment or trading decisions.

Bullish Engulfing Long Position IOCBullish Engulfing Long Position IOC
15min time frame
1:2 Profit Ratio

IOC - Is more steam left here after this much insane rally?IOC - CMP 188
Long Term One Line resistance is saying Yes, There is more steam left.
Long Term Chart is saying there is chance of ₹280 in coming months which is almost 50% Upside.
Stock is looking very good to add in every dip for upcoming targets of upper line resistance.
Support 150 (Add more if comes)
Resistance 220-250-280
Note : Personal View only, Not a Recommendation. Personally Invested.

IOCI am not the best analyst like the other social media experts. I am just a beginner and self investor. Please DYOR

#StrongBuy #IOCLIOCL made a strong Bullish Structure on a Monthly timeframe.
It's a strong Buy on a Decent Dips.
Monthly Resistance Breakout.
Short Term targets 🎯 on Charts.

IOC WEEKLY CHARTIOC WEEKLY CHART
Cmp 103.30 Breakout @ 102 Target 154
This stock has witnessed a falling trend line breakout along with resistance breakout @ 102 levels.
Its only an observation & not any suggestion.

Indian Oil looks good for 30-40% upside in coming months#IOC looks great here as it is breaking out
30-40% move is possible in coming months.
More so, If anyone is holding this for long-term, along with the upside, there is a good % that one can earn in terms of Dividend yield. In the past 12 months, Indian Oil Corporation Ltd. has declared an equity dividend amounting to Rs 8.00 per share. At the current share price of Rs 106.55, this results in a dividend yield of 7.51%

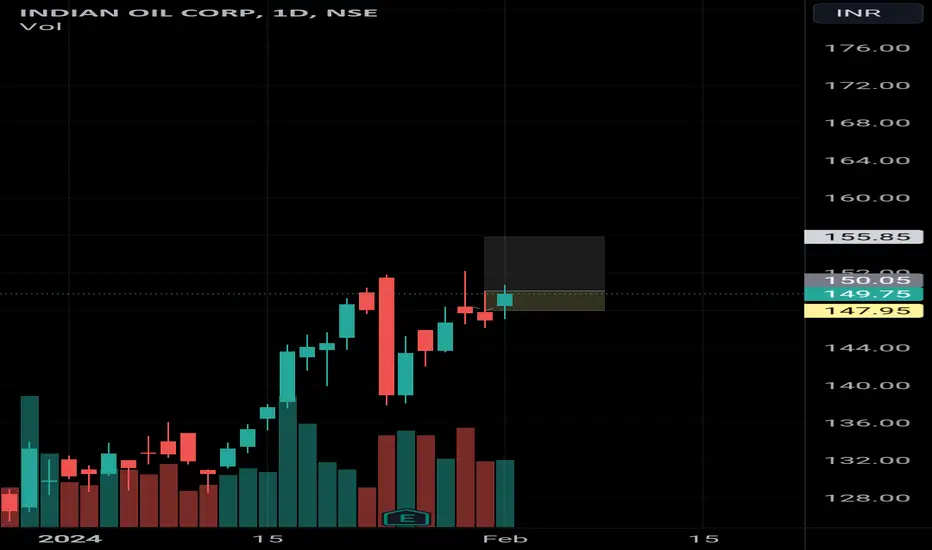
Ioc break out ??Ioc can give a good swing or positional if sustains above 150 with a minimum stoploss
Entry - 150
Stoploss- 147.8
Targets - 155, 160, 165++
Note- if any trade or value that's gone from the level we thought to enter that's not our trade just let it go.
I'm not sebi registered this is my personal view.
Investment pick of the week. IOCLast week, IOC has given breakout and closing above its all time high of 150 which was made in May 17. Now the stock is ready to up wards in a blue sky territory. This is one of the most dividend giving PSU. Company has been maintaining a healthy dividend payout of 46.4% (better than any bank FD's), hence its a worth of a trade.
Since it has hit its all time high, there is a higher probability of the stock taking resistance. I would recommend to accumulate this stock on each dip. If we get 2 consecutive weekly closing above this price, buy aggressively. If by luck you get this stock around 115 buy aggressively.
CMP - 163 (4/2/24)
T - 200, 300
SL - 125 W

