IRCTCTIRCTC Top Trendline 3rd touch with Bearish Engulf let us check double bottom will support or not
IRCTC trade ideas

IRCTCIndian Railway Catering and Tourism Corporation (IRCTC) is a Mini Ratna (Category-I) Central Public Sector Enterprise under the Ministry of Railways, Government of India.
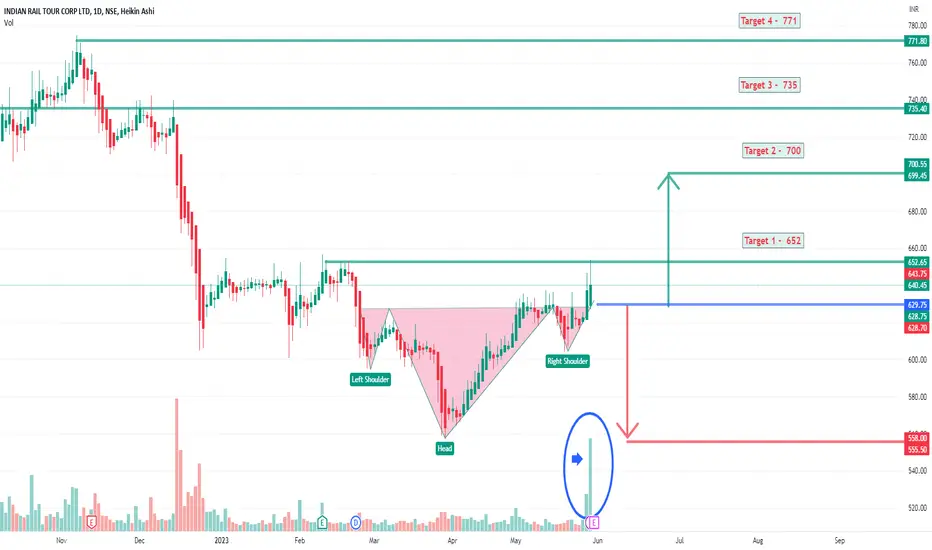
Inverse Head and shoulder - Targets mentioned in chart , SL as per your risk appetite
Market Cap
₹ 51,504 Cr.
Current Price
₹ 644
High / Low
₹ 775 / 557
Stock P/E
52.2
Book Value
₹ 31.0
Dividend Yield
0.57 %
ROCE
59.0 %
ROE
45.2 %
Face Value
₹ 2.00
Promoter holding
62.4 %
EPS last year
₹ 12.6
EPS latest quarter
₹ 3.48
Debt
₹ 84.2 Cr.
Pledged percentage
0.00 %
Net CF
₹ 23.2 Cr.
Price to Cash Flow
98.3
Free Cash Flow
₹ 502 Cr.
Debt to equity
0.03
OPM last year
36.0 %
OPM 5Year
33.2 %
Reserves
₹ 2,318 Cr.
Price to book value
20.8
Int Coverage
83.4
PEG Ratio
1.50
View For IRCTC View For IRCTC
The Chart shows that Stock has broken the Resistance level and now it's taking support of Trend line.


Bullish Head And Shoulder Breakout in IRCTCBullish Inverse Head & Shoulder Breakout in IRCTC.
The price has given a daily closing above the neckline with good volumes.
Expecting price to rise further.
Entry can be initiated now or even on retest of 658.
Targets:-
1. 702
2. 740
Stop loss below 635.

IRCTC: The rail pack run?IRCTC seems to be broke out of a inverted H and S or CnH, the scrip is above all important MAs, if this sustains, the stock can give good returns. A lot of overhead resistance it needs to fight.

IRCTC WEEKLY BREAKOUTIRCTC has given a weekly breakout, from here we can plan SWING/INVESTMENT plan.

IrctcIrctc Chart Analysis............17/06/23
My View Irctc Short Side
I think I want to buy 590ce@57.10
& irctc jun future sell @668.65
Max loss : +18856
max profit : Unlimited
Note: No Trading advice, only my view sharing for knowledge basis without loss strategies....


IRCTC - Bullish Consolidation BreakoutNSE: IRCTC is closing with a bullish consolidation breakout candle supported with volumes.
Today's volumes and candlestick formation indicates strong demand and stock should move to previous swing highs in the coming days.
The stock has been moving along the horizontal support for the past few days which is indicating demand.
One can look for a 8% to 12% gain on deployed capital in this swing trade.
The view is to be discarded in the event of the stock breaking previous swing low.
#NSEindia #Trading #StockMarketindia #Tradingview #SwingTrade

Long view on irctcMaking higher high , buying volume is good , in short term target is 100 rupee in put sl 30 rupee
Not trading advice, do your own research

IRCTC Inverse H&S BreakoutIRCTC has made a strong double bottom at 560 and higher high pattern started after breakout from 656 with Inverse H&S pattern

IRCTC LOW RISK HIGH REWARD IDEAAs per my analysis, NSE:IRCTC is at best buy level of 620 with stop loss of 600 (-20 Points).
My expected upside target would be 632 & 687 (If price sustained above level of 635)
Note: This is my personal analysis, only to learn stock market behavior. Thanks.

IRCTC CMP 628 DAILY CHARTIRCTC CMP 628. Trend line breakout confirmation. Price breakout above 657 neded for a Bullish Momentum


IRCTC bullishIRCTC trendline breakout on 17-04-2023
1st target 654 stoploss 580
2nd target 711
3rd target 765
4th target 917
keep trail your stoploss on target-wise

IRCTC FORMED DOUBLE BOOTOM STRUCTUREThe price corrected almost 55% from the all time high level of 1280. Now price near the weekly support of 550 and formed double bottom structure on weekly timeframe. price indicating perfect low risk & high rewards setup. The level of 550 is strong support level for the price & my initial targets will be 655/700/788 for the upside momentum of stocks. If price closes below 550 level on weekly chart than more fall can be seen in the price.


IRCTC weekly IRCTC weekly setup poised for decent uptrend again
bollinger bands squeezing near supports, volumes drying
railways theme is the flavor currently
SL 560 weekly closing basis

IRCTC Support Zone IRCTC Strong support zone 595
Major Weekly support 560
Traders can short below 594 Than stop loss can be maintain as per given Resistance zone target can be 560 484 417+++
Positional view

IRCTC Double bottom Make or Break ZoneIRCTC Today make DOUBLE TOP Zone
Make Or Break Zone 540 568
If Monthly Closing Below 548 540
than upcoming days we can see 490 448 424 384+++
Fresh long & Short - Wait for confirmation 👍

Trending In negative channel and most probably to do so in futurDaily chart analysis of IRCTC,
Trending in negative channel. No chance of upside unlesss breaks channel in upward direction.
Breakout in below trend line or support level of 550, will open the room for levels of 400 and 270.
