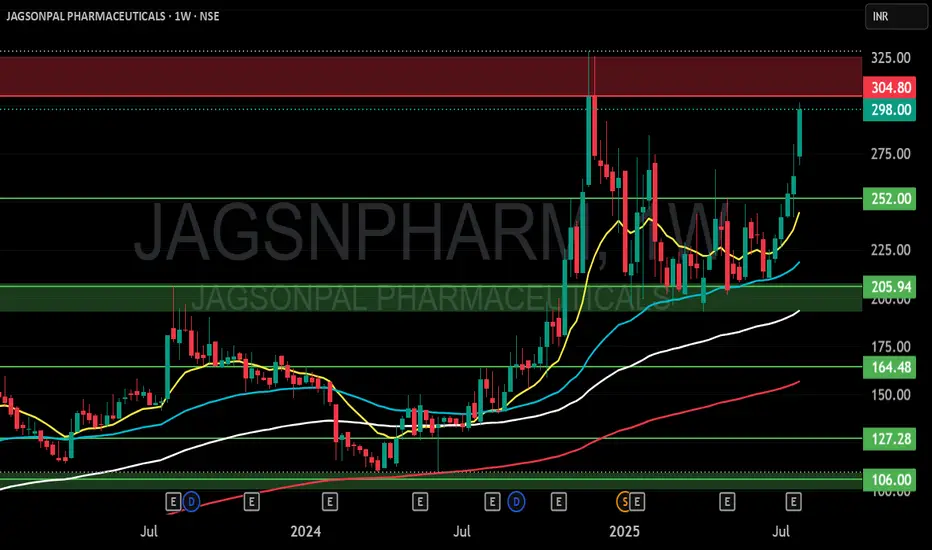
JAGSONPAL PHARMACEUTICALS S/RSupport and Resistance Levels:
Support Levels: These are price points (green line/shade) where a downward trend may be halted due to a concentration of buying interest. Imagine them as a safety net where buyers step in, preventing further decline.
Resistance Levels: Conversely, resistance levels (red line/shade) are where upward trends might stall due to increased selling interest. They act like a ceiling where sellers come in to push prices down.
Breakouts:
Bullish Breakout: When the price moves above resistance, it often indicates strong buying interest and the potential for a continued uptrend. Traders may view this as a signal to buy or hold.
Bearish Breakout: When the price falls below support, it can signal strong selling interest and the potential for a continued downtrend. Traders might see this as a cue to sell or avoid buying.
MA Ribbon (EMA 20, EMA 50, EMA 100, EMA 200) :
Above EMA: If the stock price is above the EMA, it suggests a potential uptrend or bullish momentum.
Below EMA: If the stock price is below the EMA, it indicates a potential downtrend or bearish momentum.
Trendline: A trendline is a straight line drawn on a chart to represent the general direction of a data point set.
Uptrend Line: Drawn by connecting the lows in an upward trend. Indicates that the price is moving higher over time. Acts as a support level, where prices tend to bounce upward.
Downtrend Line: Drawn by connecting the highs in a downward trend. Indicates that the price is moving lower over time. It acts as a resistance level, where prices tend to drop.
Disclaimer:
I am not SEBI registered. The information provided here is for learning purposes only and should not be interpreted as financial advice. Consider the broader market context and consult with a qualified financial advisor before making investment decisions.
JAGSNPHARM trade ideas
Jagsonpal pharma. Breakout doneExcellent breakout and now will retract a little before further rally towards target.

JAGSNPHARM - Reversal signA very positive reversal sign in JAGSNPHARM can be seen.
Taken support of 20EMA band and also support from RSI 50.
you can use marked SL and Target or do your own study and find one.
Do your own study and analysis and act accordingly.
Strictly follow Risk Reward management and strict SL is necessary.

52 Week High Breakout - Positional Trade - Long TermDisclaimer: I am not a Sebi registered adviser.
This Idea is publish purely for educational purpose only before investing in any stocks please take advise from your financial adviser.
52 Week Breakout. Stock has Crossed 52 week High. Keep in watch list. Buy above the high. Suitable for Positional Trade. Stop loss & Target Shown on Chart. Stop loss Trail by 30 SMA. Exit if Price Close below 30 SMA on Weekly Chart.
Be Discipline because discipline is the Key to Success in the STOCK Market.
Trade What you see not what you Think.

JAGSNPHARMA 1W TIMEFRAME PROJECTIONJAGSNPHARMA 1W TIMEFRAME PROJECTION
Market Behave Sideway.
If Breakout happen then it's Bearish.

Key Support & Resistance Breakout - Swing TradeDisclaimer: I am not a Sebi registered adviser.
This Idea is publish purely for educational purpose only before investing in any stocks please take advise from your financial adviser.
Key Support & Resistance Breakout. Stock has give Breakout of Resistance level. Keep in watch list. Buy above the high. Suitable for Swing Trade. Stop loss & Target Shown on Chart.
Be Discipline because discipline is the Key to Success in the STOCK Market.
Trade What you see not what you Think

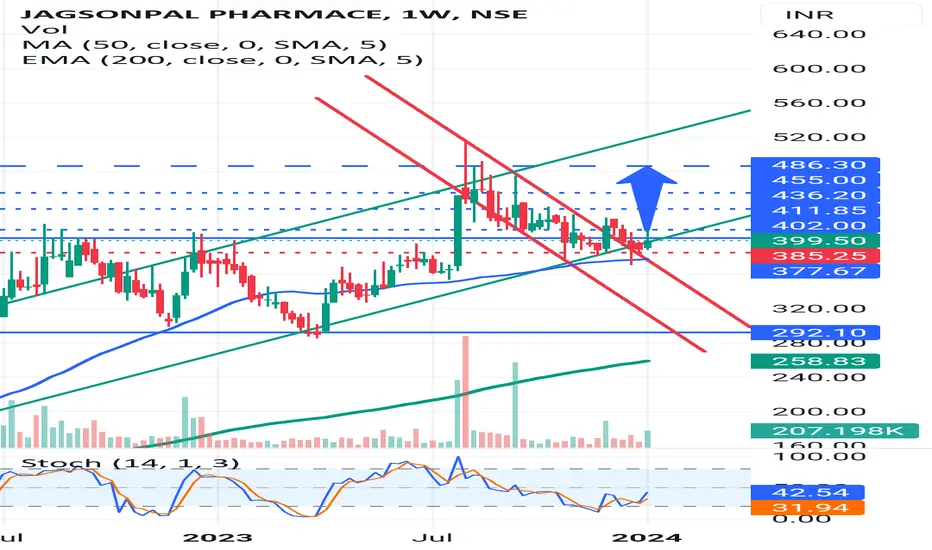
Strong Swing Upside candidate JAGSNPHARMAs we can see Pharma index on the verge of Breakout. Jagsonpal looking strong on chart.
Entry near 400-410 range SL below 377 on Closing basis. Rest details Given on chart.!!!

#JAGSNPHARM Ready for a potential breakout !🌟PROS :
⭐️- Company is almost debt free.
⭐️-Company has delivered good profit growth of 35.2% CAGR over last 5 years
⭐️-Company has been maintaining a healthy dividend payout of 40.0%
⭐️-Company's working capital requirements have reduced from 46.6 days to 35.6 days
Technical View :
🌟- Base breakout & again consolidating in small base.
🌟- Price Respecting 20 & 50 EMA
🌟- Breakout above 490🌟
🌟- 45% upthrust seen in stock recently.
🌟- RR Favorable for going long.
Don't forget to hit that❤️for a like🔁for a share,and🔖for a bookmark!

Fourty percentage profit expected in one monthBest swing stock Fourty percentage profit expected in one month

JAGSNPHARM NSE BULLISHVIEW ABOVE 370 CMP 370.5JAGSNPHARM NSE is bullish if 370 holds. NEW LIFETIME High. Fresh Breakout. Positive Trend.
Disclaimer: Educational Purpose Only. Not Buy Sell Reco. Not Sebi Registered.


Jagsonpal Looks GoodChart Looks Good
Nice Consolidation
Delivery Quantity 14X times
High Chances there will be breakout

JAGSONPAL PHARMA AS ON 03.08.2021A GOOD CALL FROM MACD AND RSI !!
CAN MAKE A GOOD MOVE !!
MADE 100rs HIGH IN 3 MONTHS!!
TARGET PRICE= 3-4%
STOP LOSS= GO WITH TRAILING STOP LOSS OR 188/189!!
(THE ABOVE ANALYSIS IS JUST FOR STUDY PURPOSE DONT TAKE IT AS ANY BUY OR SELL CALL)

JAGSONPAL PHARMACE - My Hunch - could be ExplosiveNothing much to draw here.
A channel in which it has been moving and on the monthly Time Frame I see a breakout.

Long Term Wealth Creation Idea 2020 #4#JAGSNPHARM 43.8 | Accumulate with long term perspective upto 35 levels at least for 2x/3x+ gains...
Valuation | Dividend | P/E | P/B : Lucrative
Favorable Portfolio allocation : Upto 5% of Overall Capital

JAGSNPHARM - long, SL 29.4High volume breakout after long period. If closed above 35 on weekly base, good signal for strong upside
