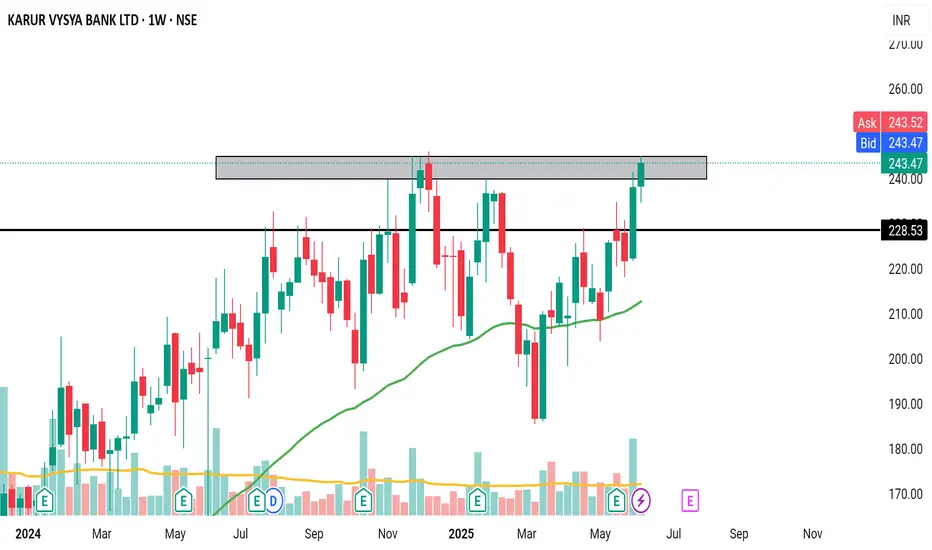
Amazing breakout on WEEKLY Timeframe - KARURVYSYACheckout an amazing breakout happened in the stock in Weekly timeframe, macroscopically seen in Daily timeframe. Having a great favor that the stock might be bullish expecting a staggering returns of minimum 25% TGT. IMPORTANT BREAKOUT LEVELS ARE ALWAYS RESPECTED!
NOTE for learners: Place the breakout levels as per the chart shared and track it yourself to get amazed!!
#No complicated chart patterns
#No big big indicators
#No Excel sheet or number magics
TRADE IDEA: WAIT FOR THE STOCK TO BREAKOUT IN WEEKLY TIMEFRAME ABOVE THIS LEVEL.
Checkout an amazing breakout happened in the stock in Weekly timeframe.
Breakouts happening in longer timeframe is way more powerful than the breakouts seen in Daily timeframe. You can blindly invest once the weekly candle closes above the breakout line and stay invested forever. Also these stocks breakouts are lifelong predictions, it means technically these breakouts happen giving more returns in the longer runs. Hence, even when the scrip makes a loss of 10% / 20% / 30% / 50%, the stock will regain and turn around. Once they again enter the same breakout level, they will flyyyyyyyyyyyy like a ROCKET if held in the portfolio in the longer run.
Time makes money, GREEDY & EGO will not make money.
Also, magically these breakouts tend to prove that the companies turn around and fundamentally becoming strong. Also the magic happens when more diversification is done in various sectors under various scripts with equal money invested in each N500 scripts.
The real deal is when to purchase and where to purchase the stock. That is where Breakout study comes into play.
Check this stock which has made an all time low and high chances that it makes a "V" shaped recovery.
> Taking support at last years support or breakout level
> High chances that it reverses from this point.
> Volume dried up badly in last few months / days.
> Very high suspicion based analysis and not based on chart patterns / candle patterns deeply.
> VALUABLE STOCK AVAILABLE AT A DISCOUNTED PRICE
> OPPURTUNITY TO ACCUMULATE ADEQUATE QUANTITY
> MARKET AFTER A CORRECTION / PANIC FALL TO MAKE GOOD INVESTMENT
DISCLAIMER : This is just for educational purpose. This type of analysis is equivalent to catching a falling knife. If you are a warrior, you throw all the knives back else you will be sorrow if it hits SL. Make sure to do your analysis well. This type of analysis only suits high risks investor and whose is willing to throw all the knives above irrespective of any sectoral rotation. BE VERY CAUTIOUS AS IT IS EXTREME BOTTOM FISHING.
HOWEVER, THIS IS HOW MULTIBAGGERS ARE CAUGHT !
STOCK IS AT RIGHT PE / RIGHT EVALUATION / MORE ROAD TO GROW / CORRECTED IV / EXCELLENT BOOKS / USING MARKET CRASH AS AN OPPURTUNITY / EPS AT SKY.
LET'S PUMP IN SOME MONEY AND REVOLUTIONIZE THE NATION'S ECONOMY!
KARURVYSYA trade ideas

Karur ko watchlist mein rakhna jaroorOn the verge of breaking all time high. Good fundamentals, good volumes.
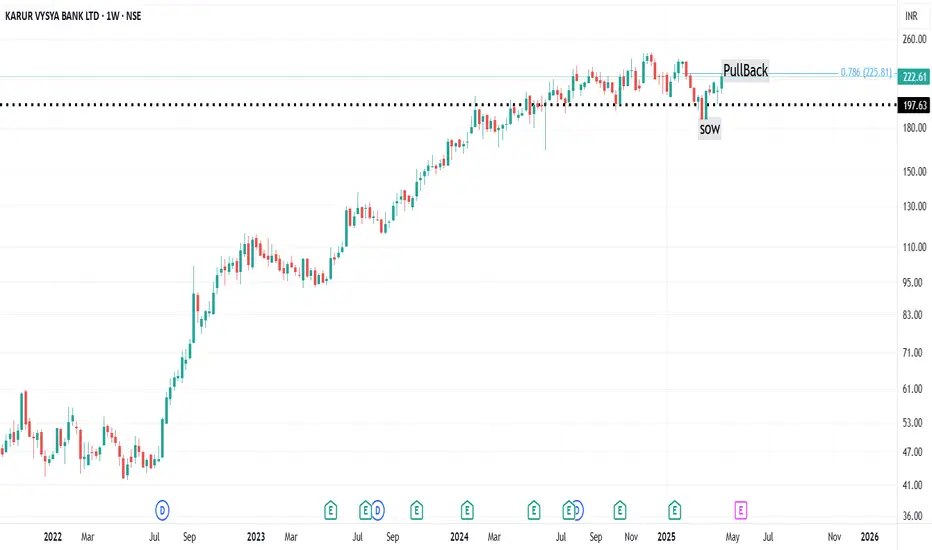
KVB 222 - Trend directionKVB 222 - IS going through Pullback test of its breakdown of 197 neckline. Signals are negatively diverged. As long as it close below 225 We shall expect KVN to drop down to 197. Breakdown of support would take to 160
( View shared on request )
karur VyasaKARURVYSYA
MTF Analysis
KARURVYSYAYearly Demand Breakout 172.2
KARURVYSYA 6 Month Demand BUFL 172.2
KARURVYSYA Qtrly Demand 172.2
KARURVYSYAMonthly Demand 190.0
KARURVYSYAWeekly Demand BUFL 204.0
KARURVYSYA Daily resistnce Now support 295.0
ENTRY -1 Long 204.0
SL 191.0
RISK 13.0
Target as per Entry 301.0
RR 7.5
Last High 246.0
Last Low 191.0

Karur Vysya BankVolumes are building up
Long for TGT 1 245,TGT 2 260
Stop Loss 230
I am not SEBI Registered.

Good swing amidst stromThis stock technically bullish
Fudamentally fine
good for swing considering range bound uptrend pattern
Targets and Sl are mentioned in chart

KARURVYSYA Swing Trading Setup1. Trend Analysis
• The stock appears to be in a consolidation phase with an upward bias as evident from the trendline support and recent breakouts.
• There is resistance around the ₹232-₹236 level, as indicated on the chart.
2. Entry Setup
• Long Entry: Consider entering a long position if the price sustains above the ₹236 resistance level with good volume. Confirmation with a strong bullish candle breaking through resistance would further strengthen the setup.
• Alternative Buy Zone: If the stock retraces to the support region around ₹218-₹220 and shows signs of a reversal (e.g., bullish candlestick patterns or increasing volumes), it could provide a better risk-reward entry for a swing trade.
3. Stop Loss
• Place a stop loss below ₹218 to protect your position in case of a trend reversal or a strong bearish move.
4. Profit Target
• Initial Target: Aim for ₹245-₹250 levels, which is the next potential resistance and psychological level.
• Second Target: If the momentum continues, ₹260 could act as a secondary target.
5. Indicators Confirmation
• RSI: The RSI indicates moderate strength, which is not overbought, suggesting room for an upside move.
• Volume: Ensure that any breakout is confirmed with higher-than-average volume for a more reliable trade.
6. Monitoring and Adjustments
• Adjust the stop loss to breakeven once the first target is hit.
• Monitor for signs of reversal or consolidation, which could indicate a potential exit or pause in the move.
Disclaimer : The information provided is for educational and informational purposes only and should not be considered as financial advice, investment advice, or a recommendation to buy or sell any securities. Trading and investing involve significant financial risk, and you should consult with a qualified financial advisor before making any investment decisions. Past performance is not indicative of future results. You are solely responsible for your trading decisions and any losses or gains you may incur. Always conduct your own research and analysis before executing trades.

Karur Vysya Bank - Pivot studyPivot breakdown & retest in last month.
This month again crossing pivot with huge volume

KARUR VYSYA BANK S/R Support and Resistance Levels:
Support Levels: These are price points (green line/shade) where a downward trend may be halted due to a concentration of buying interest. Imagine them as a safety net where buyers step in, preventing further decline.
Resistance Levels: Conversely, resistance levels (red line/shade) are where upward trends might stall due to increased selling interest. They act like a ceiling where sellers come in to push prices down.
Breakouts:
Bullish Breakout: When the price moves above resistance, it often indicates strong buying interest and the potential for a continued uptrend. Traders may view this as a signal to buy or hold.
Bearish Breakout: When the price falls below support, it can signal strong selling interest and the potential for a continued downtrend. Traders might see this as a cue to sell or avoid buying.
20 EMA (Exponential Moving Average):
Above 20 EMA(50 EMA): If the stock price is above the 20 EMA, it suggests a potential uptrend or bullish momentum.
Below 20 EMA: If the stock price is below the 20 EMA, it indicates a potential downtrend or bearish momentum.
Trendline: A trendline is a straight line drawn on a chart to represent the general direction of a data point set.
Uptrend Line: Drawn by connecting the lows in an upward trend. Indicates that the price is moving higher over time. Acts as a support level, where prices tend to bounce upward.
Downtrend Line: Drawn by connecting the highs in a downward trend. Indicates that the price is moving lower over time. It acts as a resistance level, where prices tend to drop.
RSI: RSI readings greater than the 70 level are overbought territory, and RSI readings lower than the 30 level are considered oversold territory.
Combining RSI with Support and Resistance:
Support Level: This is a price level where a stock tends to find buying interest, preventing it from falling further. If RSI is showing an oversold condition (below 30) and the price is near or at a strong support level, it could be a good buy signal.
Resistance Level: This is a price level where a stock tends to find selling interest, preventing it from rising further. If RSI is showing an overbought condition (above 70) and the price is near or at a strong resistance level, it could be a signal to sell or short the asset.
Disclaimer:
I am not a SEBI registered. The information provided here is for learning purposes only and should not be interpreted as financial advice. Consider the broader market context and consult with a qualified financial advisor before making investment decisions.

Karur Vysya Bank - Swing Long SetupEnter only when 15minute candle closes above the Entry Zone Price - 220.79
Target with Risk to reward 1:2 is 250.20
Stoploss only when 1 day candle closes below the price - 206.10
Note: This is not any financial advice, this is for education purpose only.

KARUR VYASA BANKKARUR VYASA
MTF Analysis
kARUR VYASA Yearly Demand Breakout 172
kARUR VYASA 6 Month Demand Breakout 172
kARUR VYASA Qtrly Demand BUFL 135
kARUR VYASA Monthly Demand Breakout 189
kARUR VYASA Weekly BUFL 205
BOM Daily DMIP 202
ENTRY 202
SL 197
RISK 5
Target 264
REWARD POINT 62
Last High 233
RR 12.40

KarurVysa Bank-Bullish swing- History needs to repeat!! NSE:KARURVYSYA
21.08.2024
Very good upside bullish movement from last one year.
Currently it is moving in a dedicated ascending channel. Stock has returning to upside without creating HL this time.
Buy- 227
Target- 245
Stop Loss-209
Risk Reward- 1:1
1.Breakout- Inside bar & Doji
2.Trend- Upward range/trend
3.KeyLevel- Just below resistance. Need to break previous resistance for more rewards
4.Volume- Very good above average volumes in
breakout candle. Previous sessions analysis signs of bullish signals
5. EMA- Price above 21 % 51 EMA after rejecting once from 200 EMA
6. Pattern- Ascending channel with creating multiple HH & HL

Karur Vysya Bank LimitedNext Big move on Next Big move on HDFC
For Longs as price is at the Fib Golden zone, Wait for Rejection at order block with , Wait for the trend line brake with volume. take a lower time frame long entry to increase risk to reward ratio..

Karur Vyasa Bank in the Breakout zoneKVB is looking like a strong breakout candidate with price consolidating around resistance. Volumes increasing. RSI and MACD both positive.

KARUR VYSYA BANK GIVEN BRAKEOUT AT DAILY CHARTNSE:KARURVYSYA
KARUR VYSYA BANK GIVEN BRAKEOUT AT DAILY CHART
BUY 205- 208
sl 190
target 235,242+
time duration 1 month

KARURVYSYA 87%+ Gain in 1 YearKARURVYSYA has been in my bag from a year now.
Never thought this would touch 80%++ in gains.
I had sold 50% of it at 150 price level and held the remaining. I sold 25% of the remaining this morning and keeping the remaining 25% for some more gain, especially for the week after the election results.
We are for sure going to see some crazy spikes / volatility.
Anybody holding KARURVYSYA? Share your story in the comments.
God bless you and happy trading.


KARURVYSA giving BOBanknifty and nifty private bank are not outperforming the nifty in medium term. Where KARURVYSA is ATH. Clear sign of demand. BO giving with good traded and delivery volumes. This can be a leader of the group.

Karur Vysa bank Karur vysa bank is forming rounded bottom on hourly chart suggesting long for good tgt

Karurvaysya BANK : Rising Edge (swing trade)KARURVYSA bank can be considered for buy with the SL of 153.50 for the target of 162
this bank can take advantage of Small Cap rally
technicals
ABC structure has completed by the price on intermediate wave patter and ready for 5 wave on the hourly chart, here with can consider this counter for low risk and high reward for swing trade

💥Karur Vysa Bank💥-Nice Breakout💥Karur Vysa Bank💥-Nice Breakout
Capital to be deployed- 20k
Investing Price -154
Breakout Price-154
Stoploss-115
Targets-315
RT for max reach
#karurvysabank #StocksToBuy #stocks #StocksToTrade #StocksInFocus #stockstowatch #StocksInNews

KARURVYSYA Swing Trade setup.This will be my personal trade Setup, This is not an advice of any kind to initiate trade according to this setup. This is for only for my learning purpose and maintaining my trading journal.
On daily Time Frame Karurvysya is making rounding bottom pattern and is about to complete if breaks resistance of 116 with above above average volume on daily TF will buy with stop loss of low of candle below resistance, Target will be 127.
If Price rejects resistance then maybe we can expect it to form Cup & Handle like pattern.
On Weekly TF price broke through Flag & Pole Pattern and for that weekly target will be 135.
I cannot update charts or my ideas coz i don't have pro subscription i can only post additional charts if reputation level is above 10..need your supports who ever watch or agrees with setups i am posting.
Thanks everyone.

KARUR VYSYA Bank Multi Year Break Out (Resistence)
Need to sustain above 130 level that could give 5 year's break out.
Else will come down from the level.
P
