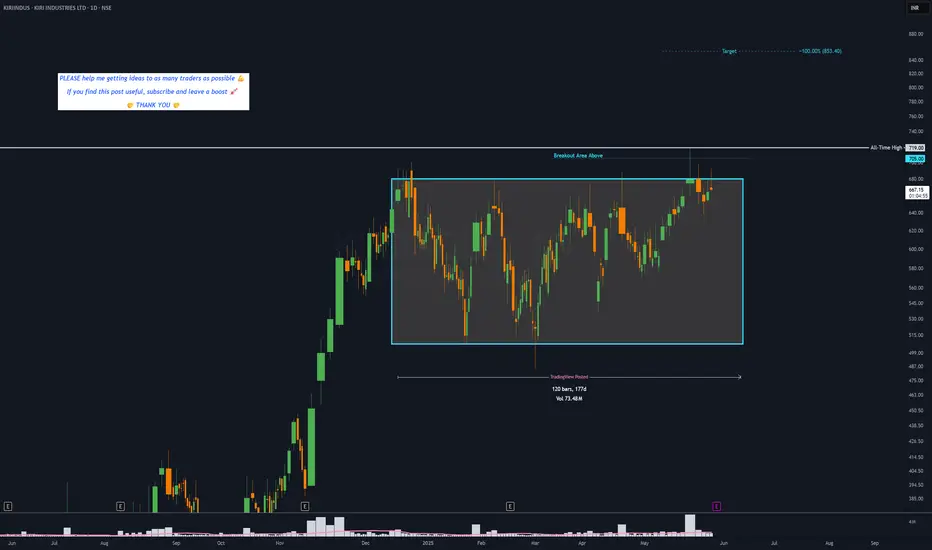
KIRIINDUS - 4 months RECTANGLE══════════════════════════════
Since 2014, my markets approach is to spot
trading opportunities based solely on the
development of
CLASSICAL CHART PATTERNS
🤝Let’s learn and grow together 🤝
══════════════════════════════
Hello Traders ✌
After a careful consideration I came to the conclusion that:
- it is crucial to be quick in alerting you with all the opportunities I spot and often I don't post a good pattern because I don't have the opportunity to write down a proper didactical comment;
- since my parameters to identify a Classical Pattern and its scenario are very well defined, many of my comments were and would be redundant;
- the information that I think is important is very simple and can easily be understood just by looking at charts;
For these reasons and hoping to give you a better help, I decided to write comments only when something very specific or interesting shows up, otherwise all the information is shown on the chart.
Thank you all for your support
🔎🔎🔎 ALWAYS REMEMBER
"A pattern IS NOT a Pattern until the breakout is completed. Before that moment it is just a bunch of colorful candlesticks on a chart of your watchlist"
═════════════════════════════
⚠ DISCLAIMER ⚠
Breakout Area, Target, Levels, each line drawn on this chart and any other content represent just The Art Of Charting’s personal opinion and it is posted purely for educational purposes. Therefore it must not be taken as a direct or indirect investing recommendations or advices. Entry Point, Initial Stop Loss and Targets depend on your personal and unique Trading Plan Tactics and Money Management rules, Any action taken upon these information is at your own risk.
═════════════════════════════
KIRIINDUS trade ideas
KIRI INDUSTRIES Breakout happend in this stock with rising 200dma and RS indicator is also showing strength.
Keep your risk and reward ratios according to your own preferance.
This is for educational purpose, do your own research before investing.


buy kiri industries at 615cup and handle on monthly chart .
buy at 614 for long term target of 3000.

Kiri Industries (KIRIINDUS): Breakout Brewing!KIRIINDUS has been **compressing volatility**, shifting from high to low—this is the classic setup for a major breakout. The big question now: **Are we going up or down?**
🔍 **Key Observations:**
- The chart is forming a tight range, signaling an imminent move.
- Momentum indicators suggest a buildup of energy waiting to be unleashed.
- Breakout direction will depend on whether buyers or sellers dominate at the boundary levels.
🔥 **What’s Your Target?**
A breakout could lead to explosive moves—are you watching for a surge upward, or are you leaning toward a downside plunge? Share your predictions and targets below!

52 Week High Breakout - Positional Trade - Long TermDisclaimer: I am not a Sebi registered adviser.
This Idea is publish purely for educational purpose only before investing in any stocks please take advise from your financial adviser.
52 Week Breakout. Stock has Crossed 52 week High. Keep in watch list. Buy above the high. Suitable for Positional Trade. Stop loss & Target Shown on Chart. Stop loss Trail by 30 SMA. Exit if Price Close below 30 SMA on Weekly Chart.
Be Discipline because discipline is the Key to Success in the STOCK Market.
Trade What you see not what you Think.

Kiris Ind Swing + Long Trade TargetsEntry Points -
Exit Point -
T1 - 730/-
T2 -
Time Frame
T1 - 4 weeks
T2 - 12 to 24 Months

KIRIINDUS CMP 530.STRONG Undervalued stock by Indicator- PE IS 10,Price to Book Value- 1,Face Value-10.TTM compounded Profit growth is super Sales Growth increasing.For long term we can add this to Portfolio.Last Months Volumes are Good.Currently trading its 52 Week high zone. Possible to make its New All Time High in coming days.Add to your wachlist And find your Risk Reward and Best Entry Exit Area Thanks.

A technical trade ATH consolidation breakout weekly TFAlmost 7 yrs consolidation channel breakout.....sl closing below upper trendline....target 1008...onlly for educational purpose and not any recommendation......

Kiri Industries - It has long way to goOne can plan to invest in this stock in a staggered manner with 520 WCB SL..
Wave 3 looks certain..

Darvas Box Strategy - Break out Stock - Swing TradeDisclaimer: I am Not SEBI Registered adviser, please take advise from your financial adviser before investing in any stocks. Idea here shared is for education purpose only.
Stock has given break out. Buy above high. Keep this stock in watch list.
Buy above the High and do not forget to keep stop loss, best suitable for swing trading.
Target and Stop loss Shown on Chart. Risk to Reward Ratio/ Target Ratio 1:1
Stop loss can be Trail when it make new box / Swing.
Be Discipline, because discipline is the key to Success in Stock Market.
Trade what you See Not what you Think.

Buy KIRIINDUSBuy KIRI INDUSTRIES above 525...Safe traders can go long above 533 or add around 510-515 levels.
Accumulate more around 500 - 507 levels.
SL 484
Targets: 565..610..675
Looks like run incoming!!


CUP & HANDLE BREAKOUT WITH VOLUMES as per chart looking good for swing, I am expecting targets of 560/580/600. Carry with SL of 504 on closing basis.

KIRIINDUS ON BREAKOUT! KIRIINDUS is Fighting to break the weekly Trendline. Keep this on your watchlist, and hope for breakout. Possible Intraday,Swing Trades above 632.

Kiri Inds-Poised for big rerating _Techno Fundamental Pick Kiri on weekly Charts has given a decisive breakout out of Multi-Year Pattern.
Things to be noted on the chart
1) Inverted H & S Breakout on exceptionally high volumes.
2) Weekly Bullish engulfing candle formed on charts this week.( Covert to candlestick and check)
Key events
1) Dystar case seems to be coming to its logical end. Singapore Supreme court final verdict on Dystar valuation and for Kiri's 7.57% stake probable by this month-end.
2) Current market-cap of Kiri is around 1800cr and the Court likely to conclude valuation for Kiri's stake in Dystar at about 350Mn USD (approx 2500cr)
and direct Senda to pay it to Kiri Industries in the stipulated period.
Fundamentals
1) Operating expense likely to reduce drastically as court case related expense would stop.
2) Stock seems undervalued at PE of 8 and for its 5yrs Avg PAT growth is in double digits, debt has been reduced, many other parameters supportive.
Disclaimer:
The above is for educational purposes.
I might be biased as I do hold a position and above data may have discrepancies.


Kiri Industries - Study - 50% upside Kiri industries is trading in a Range, Buy above 390 for the below target:
Target 1 - 439
Target 2 - 470
Target 3 - 559
Target 4 - 615
Keep stop loss at 351.

Buy Kiri inds on dipsAs seen the price is moving in tandem with Nifty Currently trading above the cloud and narrow range. Also trading above 50 and 200 EMA.

Kiri industries: Jump till 405 is possible (trend line break outit is good to buy on dips around 322-325 with SL around 298 for the TP of 404

KIRI Industries : Looks set to retest its previous highs ?Hourly charts : Looks set for a brakout above 382 levels. Volumes seem to be encouraging
Daily charts : Doji followed by a big white candle with good volumes.
Combining both of the above it looks set to retest its previous highs of 400 levels. 375 can be a SL.
