KOTAK BANK 1WKotak Mahindra Bank has recently experienced a bullish breakout, indicating a potential upward price movement. Based on technical analysis, the stock is projected to reach the 2400 price level in the near future
I'm not a SEBI-registered analyst. All posts and levels shared are just for educational purposes. I'm not responsible for any losses or profits. No claims, all rights reserved.
KOTAKBANK trade ideas
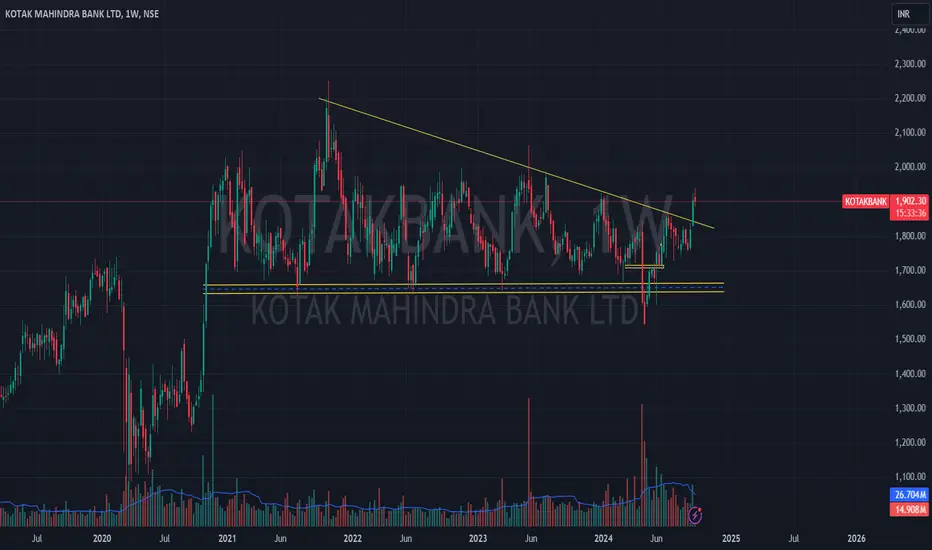
KOTAK MAHINDRA BANK BREAK OUT ON MONTHLY CHART/ UPSIDE POTENTIALThis stock is out of consolidation of almost 5 years. keep an eye of this stock start accumulating this stock on this price range. 1997 will be sl and target 2400.
Kotak Mahindra Bank has broken out of a **multi-year consolidation range** on the monthly chart. After several rejections near the 2,030–2,050 zone, the stock has now closed above this level with strong volume, indicating bullish momentum.
**Key Observations**:
* 📈 **Breakout Confirmation**: Price has closed above a major resistance zone around ₹2,050, which held for several years.
* 🟦 **Support Zone**: The previous resistance (\~₹2,030–2,050) could now act as strong support.
* 🔵 **Moving Average Support**: Price is well above the 20-period EMA (blue line), confirming trend strength.
* 📊 **Volume Spike**: Volume supports the breakout, showing institutional interest.
* 📈 **Trend**: Overall uptrend intact, with higher highs and higher lows since early consolidation phase.
**Levels to Watch**:
* **Immediate Support**: ₹2,030–2,050
* **Next Target**: ₹2,300–2,400 (previous highs and psychological zones)
* **Stop Loss for Longs**: Below ₹1,930 (monthly low or below EMA
* **Swing/Positional Trade**: Accumulate on dips toward ₹2,050–2,070 with stop-loss below ₹1,930.
* **Investors**: Could consider this as a long-term entry opportunity post multi-year breakout.
---
**Risk Disclaimer**: This analysis is for educational purposes only. Always do your own research and risk management.

KOTAKBANK Technical Analysis🏦 KOTAKBANK Technical Analysis (Daily Chart) – June 4, 2025
Current Price: ₹2,057.40
Change: +₹12.90 (+0.63%)
🔍 Chart Breakdown:
Trendline Breakdown: Price has decisively broken below the ascending trendline, indicating weakness in bullish momentum.
Bearish Structure: Lower highs and lower lows are forming — a classic sign of a downtrend resumption.
Downside Target Zone:
Primary Demand Zone: ₹1,840 – ₹1,880
🧭 Potential Scenarios:
If current bearish pressure continues, price may slide toward the highlighted demand zone.
A strong bullish rejection from the support zone could present a short-term reversal opportunity.

Kotak Bank – Structure Speaks, Are You Listening?Kotak Bank appears to be in the final stages of a WXYXZ complex correction on the weekly timeframe, with a zigzag pattern unfolding in Wave Z . A rejection from the 2301.90 zone has initiated a clean 5-wave decline, setting the tone for the final leg of the corrective structure.
This analysis combines high-level structure from the weekly chart with internal confirmations from the daily timeframe.
Weekly Chart Highlights
Wave W completed at 1631.00.
A rally into Wave X followed, peaking around 2064.40.
Wave Y took the form of a contracting triangle, breaking down to 1543.85.
From there, a sharp rally into 2301.90 formed Wave X2, failing to extend impulsively — suggesting corrective nature.
The decline from X2 is forming a potential 5-3-5 zigzag, labeled as Wave Z.
Fibonacci projection for Wave C of Z lies between 0.618 (1863.65) and 1.0 (1592.75) of Wave A.
Invalidation level: A price move above 2301.90 invalidates the Z wave scenario.
Daily Chart Observations:
The internal structure from the 2301.90 top shows:
A 5-wave decline in Wave A, ending with a clear ending diagonal in the 5th wave.
This suggests exhaustion and a likely short-term bounce.
Wave B is anticipated as a 3-wave corrective rally, targeting:
0.5 retracement at 2168.05
0.618 retracement at 2199.65
A final 5-wave decline from there would complete Wave C and conclude the larger Wave Z.
Conclusion
Kotak Bank is potentially in the final zigzag leg (Wave Z) of a larger WXYXZ correction that has been unfolding for over two years. With multi-timeframe confluence and a clean internal structure, the path forward suggests a short-term bounce followed by one last leg down.
This setup offers high clarity for both short-term traders and long-term positional analysts awaiting the completion of a Wave 4 before a possible Wave 5 rally.
Price action will be updated as chart evolves.
Disclaimer: This analysis is for educational purposes only and does not constitute investment advice. Please do your own research (DYOR) before making any trading decisions.

Kotak Bank: Impulse formationStock is rising in an impulsive manner and currently trading under wave-4 correction. This correction is likely to conclude in the zone of 2215-2200 zone and then we can expect another rally on the upside under wave-5 towards 2350 zone.

kotak same down kotak same down
Stock Performance: The current share price is ₹2,123.40, with a 0.15% increase from the previous close. The stock has seen a 52-week high of ₹2,202.50 and a low of ₹1,543.85

KOTAK BANKNSE:KOTAKBANK
Note :
1. One should go long with a Stop Loss, below the Trendline or the Previous Swing Low.
2. Risk :Reward ratio should be minimum 1:2.
3. Plan your trade as per the Money Management and Risk Appetite.
Disclaimer :
>You are responsible for your profits and loss.
>The idea shared here is purely for Educational purpose.
>Follow back, for more ideas and their notifications on your email.
>Support and Like incase the idea works for you.

Kokat Bank - Long Setup (Weekly view)Good setup in Kotak Bank after long consolidation. Have been in upmove for last few days. Looking good on weekly basis. Banks in general have been showing strength. Should see further move beyond 2250, if a new base is formed in that region.
Please note, this is a not a buy/sell reco. For study purpose only.
Thanks

Kotak Bank longOnly when it is retesting the breakout......
just for learning purposes.
Keep an eye out for volume, RSI and MACD gap

Kotak Mahindra Bank Consolidation Rectangle Breakout.Kotak Mahindra Bank is Consolidating since 2021 in a Rectangle Pattern.
Breakout of the level 2050 with the Volume increase.
CMP 2079
It should Retest 2050 again and then rally towards atleast 2500
Lets! Hope for the Best!

KOTAK BANK: PREPARING FOR A BREAKOUTStock traded in a range of 2060 and 1640 since Oct'21. The current price action suggests for a breakout of the rectangular range. A sustained breakout shall push the prices higher towards 2590-2600 zone in the coming weeks and months ahead.

KOTAKBANK KEY LEVELS FOR 17/02/2025//description
// All credit goes to Tony for the concept of this indicator. His Trading View link: www.tradingview.com
// Note: The calculation method in this indicator differs from Tony's, but the concept is derived from his work.
I want to make it clear that I am not a seller, and this method was not taught to me by anyone. The original creator only gave me one clue:
👉 "If you get one level, you get all levels."
Everything else—the way I nail it the method and applied it—is my own work. I respect the original idea, but my approach is independent.
Explanation:
This trading system helps you avoid blind trades by providing confirmation for better entries and exits.
Entry/Exit Points:
- Entry/Exit Lines: Use the BLACK line for long trades and the RED line for short trades, based on confirmation from your trading plan.
- Stop Loss: For long trades, set the stop loss at the RED line below. For short trades, set it at the BLACK line above.
- Take Profit: For long trades, target the next RED line above. For short trades, target the next BLACK line below.
Timeframe:
Use a 5 mins timeframe for trading.
Risk Disclaimer:
This setup is for educational purposes. I'm not responsible for your gains or losses. Check the chart for more details.

KOTAKBANK ! If weekly close above 1975Disclaimer:
This is not financial advice. Please do your own research or consult with a financial advisor before making any investment decisions. Investments in stocks can be risky and may result in loss of capital.

KOTAK BANK | LONG | BTSTKOTAK BANK continues to look Bullish amidst the sell off in the broad markets.
Stock continues to hold the major Pivots and now is en route to test the price levels of 1985.
SL would be bearish candle close below 1904.

Kotak mahindra bearish pattern Kotak mahindra bearish pattern cmp 1929 on 09.02.2025 looking trend change if reverse from the marked level

Kotak Bank Breaks Out of Long Consolidation Range: What's Next.?Kotak Mahindra Bank's share price rose more than 9% after the release of its third-quarter results, marking a significant breakout after an 18-day period of consolidation.

KOTAKBANK KEY LEVELS FOR 03/02/2025**Explanation:**
This trading system helps you avoid blind trades by providing confirmation for better entries and exits.
**Entry/Exit Points:**
- **Entry/Exit Lines:** Use the BLACK line for long trades and the RED line for short trades, based on confirmation from your trading plan.
- **Stop Loss:** For long trades, set the stop loss at the RED line below. For short trades, set it at the BLACK line above.
- **Take Profit:** For long trades, target the next RED line above. For short trades, target the next BLACK line below.
**Timeframe:**
Use a 5 mins timeframe for trading.
**Risk Disclaimer:**
This setup is for educational purposes. I'm not responsible for your gains or losses. Check the chart for more details.

KOTAK BANK SHORT TRADE (WAITING )Trading Near Rejection Zone
Again Rejection at Monthly, Weekly, Daily UPPER BAND
As There is Very Low Probability that price sustain above UBB when BB is expanded it will may start falling once PVT BANK also give new low in 60 min
Waiting for 60 min Trend change
once it 60 min trend change to SW will take action depending on the new price action in 60 min

KOTAK BANK | SHORT | SWINGKOTAK BANK is overbought and it showing signs of reversal from the highs.
Observe the Lower highs being formed on the hourly chart which means that the buyers are unable to take the price any higher.
The first hour candle has closed quite bearish.
I've taken short position for a Target of 1830.
SL is current day High.

KOTAKBANK KEY LEVELS FOR 23/01/2025**Explanation:**
This trading system helps you avoid blind trades by providing confirmation for better entries and exits.
**Entry/Exit Points:**
- **Entry/Exit Lines:** Use the BLACK line for long trades and the RED line for short trades, based on confirmation from your trading plan.
- **Stop Loss:** For long trades, set the stop loss at the RED line below. For short trades, set it at the BLACK line above.
- **Take Profit:** For long trades, target the next RED line above. For short trades, target the next BLACK line below.
**Timeframe:**
Use a 5 timeframe for trading.
**Risk Disclaimer:**
This setup is for educational purposes. I'm not responsible for your gains or losses. Check the chart for more details.

KOTAK MAHINDRA BANK LTD S/RSupport and Resistance Levels:
Support Levels: These are price points (green line/shade) where a downward trend may be halted due to a concentration of buying interest. Imagine them as a safety net where buyers step in, preventing further decline.
Resistance Levels: Conversely, resistance levels (red line/shade) are where upward trends might stall due to increased selling interest. They act like a ceiling where sellers come in to push prices down.
Breakouts:
Bullish Breakout: When the price moves above resistance, it often indicates strong buying interest and the potential for a continued uptrend. Traders may view this as a signal to buy or hold.
Bearish Breakout: When the price falls below support, it can signal strong selling interest and the potential for a continued downtrend. Traders might see this as a cue to sell or avoid buying.
MA Ribbon (EMA 20, EMA 50, EMA 100, EMA 200) :
Above EMA: If the stock price is above the EMA, it suggests a potential uptrend or bullish momentum.
Below EMA: If the stock price is below the EMA, it indicates a potential downtrend or bearish momentum.
Trendline: A trendline is a straight line drawn on a chart to represent the general direction of a data point set.
Uptrend Line: Drawn by connecting the lows in an upward trend. Indicates that the price is moving higher over time. Acts as a support level, where prices tend to bounce upward.
Downtrend Line: Drawn by connecting the highs in a downward trend. Indicates that the price is moving lower over time. It acts as a resistance level, where prices tend to drop.
Disclaimer:
I am not a SEBI registered. The information provided here is for learning purposes only and should not be interpreted as financial advice. Consider the broader market context and consult with a qualified financial advisor before making investment decisions.

EXPECTED 37% GROWTH IN KOTAK MAHINDRA BANKalmost 37% Upside pontential long term growth assumed in NSE:KOTAKBANK
So here investment levels to watch 👀
📝 Key Observations
Consolidation Phase 📊
The stock is currently trading within a range of INR 1,697 - INR 1,951, forming a consolidation phase. My break this time.
This represents an accumulation zone, indicating that buyers and sellers are in balance.
A potential breakout is expected, which could lead to a strong upward trend.
Targets (TP) 🎯
TP-1: INR 1,852.55 🟠 (Immediate Resistance Level).
TP-2: INR 1,951.70 🟡 (Range Upper Boundary).
TP-3: INR 2,065.40 🟢 (Breakout Target).
TP-4: INR 2,251.20 🚀 (Long-Term Target).
These targets align with key resistance zones, representing price points where the stock may pause or reverse.
🔷️Entry & Risk Management ⚠️
Ideal Entry Point: Around INR 1,697.50 🟦 (Support Level).
🔴Stop-Loss (SL): INR 1,603.95 to manage risk if the trade goes against expectations.
The risk-reward ratio is highly favorable, making this setup attractive for long-term investors.
📶Long-Term Upside 📈
The analysis suggests a 37% upside, projecting a price of INR 2,250+ by 2025 🌟.
This projection aligns with the stock's historical performance and potential future growth.
🔍 Patterns & Projections
The X-Y-Z wave projections on the chart depict possible price movements.
X Wave: Initial upward momentum post-breakout.
Y Wave: Temporary correction before resuming the uptrend.
Z Wave: Continuation to higher highs.
The green zone (consolidation range) acts as a launchpad for future growth.
📌 Takeaways
Plan Smart: Follow the entry level and stop-loss strictly to manage risk effectively.
Growth Potential 🚀: The stock shows strong long-term bullish prospects.
Risk-Reward: This setup offers high potential rewards with a well-defined risk framework.
🔴DISCLAIMER:
I AM NOT A SEBI-REGISTERED ANALYST. SECURITIES AND INVESTMENTS ARE SUBJECT TO MARKET RISKS. PLEASE READ AND UNDERSTAND THE TRADING IDEA CAREFULLY BEFORE MAKING ANY INVESTMENT DECISIONS. INVEST WISELY AND AT YOUR OWN RISK. 📉📈
If you really like this idea....
Like,share,subscribe @Alpha_strike_trader

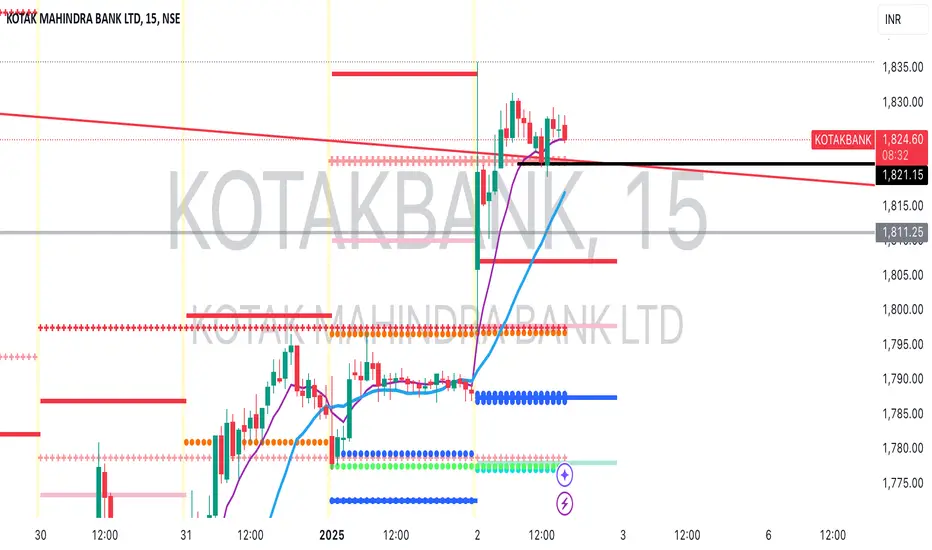
Kotak Bank | Short | STBTHappy New Year 2025 to all!
As the first trade for 2025, I see Kotak Mahindra providing a good shorting opportunity.
The stock has shot up today and has hit the downward resistance zone trend line.
A short position can be taken once price closes strongly below 1820.
Downside target - 1787
SL - Today's high.