Potential breakout signs in Kotak Mahindra BankKOTAK MAHINDRA 1D Chart Analysis
Showing great resistance/sellers area between 1800-1830. A strong support line is also identified.
✅ Must wait for breakout with a candle closing above resistance area with high volumes.
✅ Target somewhere around 2020.
🚨 Just my analysis, Not a tip
KOTAKBANK trade ideas

KOTAK BANKPattern breakout and tested support level (1700)
Placed GTT in zerodha @ 1700, i miss the 1st chance (@ 1700)
1) Planning to enter if stock broke 1830 with good volume or
2) If it fails to broke 1830 waits till 1700

KOTAK MAHINDRA BANKBuy @1840 SL 1800 Target 1:2 If nifty and banknifty will be bullish then it will surely give break out.


Go Long on Kotak Mahindra BankInverted Head & Shoulder .
Morning Star Candle Pattern
EMA Supports
Three Confluences to take the trade!

Buy after breakout and retest There will be a good opportunity to buy if there is upside breakout with good volume.

View About KOTAK MAHINDRA BANKThe stock is facing very good resistance at 1824 now it's exactly at it's resistance now if the stock gives breakout above 1824 and sustains above it then it will surely go to it's previous highs in medium term 😊

KOTAK MAHINDRA BANK, Triangle BreakoutAfter a long sideways trend Kotak Mahindra bank today has shown some signs of a Breakout.
The targets are already mentioned.

My view on Kotak bankKotak bank looking good.Forming inverse H&S pattern.Above 1810 should hit 1840-1860-1880++

Kotak Mahindra Bank is ready To breakout Once Kotak Mahindra Bank break 1820 it will break for target 2250 in next 6 months

KOTAK MAHINDRA can go up 20% targeti have mentioned kotak mahindra in this video
and also dicussed such a wonderful strategy which tells how to stay in any stock when target not get to hit without any headache .
explore more

Trading Pennants You can see a pennant formation in this dailychart of Kotak Mahindra, most likely to give a breakout. Pennant A gave a breakout but sellers took the hold and price again tested the support level and again buyers took the charge. Stock has touched 1702 support level many a times never breaking down. Buyers always take the hold of it whenever it touches the support level. A solid consolidation above the support line, along with two pennant formations, predicts a good upcoming rally which may touch the resistance level around 2000. Target Price-2025, SL- 1700.

brokout finally........u can notice clearly after a very long consolidation finally kotak bank has brokout
Target 1820++


Kotak MahindraExpecting a Bullish Momentum after a deep correction, Seems buyers are in..
Time to Book some profits ..

Price ActionTrend lines can be used to trade, if it closes beyond those trend lines trade can be taken respectively


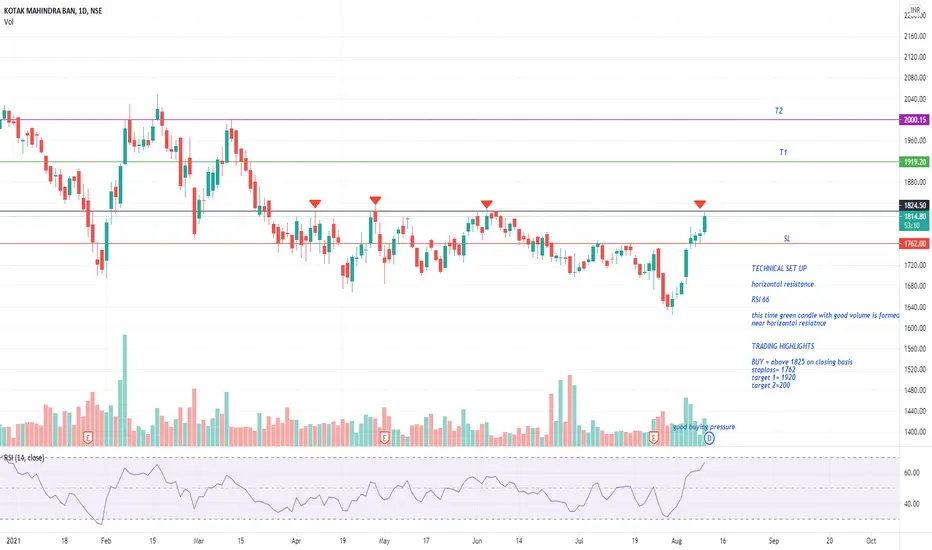
near horizontal resistance breakout in kotak bankTECHNICAL SET UP
horizontal resistance
RSI 66
this time green candle with good volume is formed
near horizontal resiatnce
TRADING HIGHLIGHTS
BUY = above 1825 on closing basis
stoploss= 1762
target 1= 1920
KOTAK MAHINDRA BANK as on 23.08.2021CORRECTION DONE!!
CANDLE RTESTED PERFECTLY!!
Hammer candle formed today!!
A Good call!!
Going according to my analysis!!
VISIT PROFILE FOR FURTHER ANALYSIS!!🔥❤️
(ONLY FOR STUDY PURPOSE)

KOTAK MAHINDRA BANK as on 06.08.2021FALLING WEDGE PATTERN FORMED!!
Breakout candle also formed!!
MACD showing strength!!
RSI above 60!!
SAME PATTERN FORMED IN A WEEKLY CHART TOO WITH BREAKOUT!!
Flag formed in a Monthly chart with a breakout candle!!
EMA 5DEMA crossing 13 and 26 DEMA in day chart!!
SO many confirmations!!
CAN MAKE A NEW HIGH!!
TARGET=1900/2000
STOP LOSS= 1750/1630 OR TRAILLING STOP LOSS!!
(THE ABOVE ANALYSIS IS ONLY FOR STUDY PURPOSE DO NOT TAKE IT AS ANY BUY OR SELL CALL)

kotak bankkeep in radar , has given falling wedge breakout . may come to 1730 level for retest , one can add for target 2100

Buy KOTAK MAHINDRA BANK - CHANNEL BREAKOUT-POSITIONAL Refer chart for more details
Buy @1780 for target of 1930.
Stoploss daily close below 1750
