MARUTI | SHORT | SWINGMaruti price action depicts weakness.
Lower highs being formed after a brief rally. This is a clear sign of reversal from the top.
Short position can be taken for a target to around 11,400 price levels.
MARUTI trade ideas

Maruti LongMaruti
MTF Analysis
MarutiYearly Demand 9769
Maruti 6 Month Demand 10932
MarutiQtrly Demand BUFL 10932
MarutiMonthly Demand 10345
MarutiWeekly Demand 10973
MarutiWeekly Supply 1088
MarutiDaily Demand DMIP 10830
ENTRY -1 Long 10830
SL 10392
RISK 438
Target as per Entry 12800
RR 4
Positional Target 16462
Target Points 1,970
Recent High 13,541
Recent Low 10,725

Maruti is the best script for shortingLong base breakdown. Initiate short near 10 EMA around 10900. Hold for one month, you will be rewarded. Keep SL at 11100.

Maruti Suzuki India Ltd: Super Trade Alert!🚗💥 This Trade Blow Your Mind 💥🚗
This setup is looking explosive—get ready for a mind-blowing move! 🚀 Maruti Suzuki is poised for a stellar run, and this could be your ticket to ride the wave.
🔑 What’s the buzz?
Strong technical setup forming, indicating a potential breakout.
Key levels identified—entry from my mark for maximum impact.
Momentum is building, and this one looks ready to shift gears toward new highs.
Long from my mark, and hold tight—this one’s a rocket! 🚀

MARUTI KEY LEVELS FOR 16/12/2024**Explanation:**
This trading system helps you avoid blind trades by providing confirmation for better entries and exits. It considers volume, past prices, price range and indiavix.
**Entry/Exit Points:**
- **Entry/Exit Lines:** Use the BLACK line for long trades and the RED line for short trades, based on confirmation from your trading plan.
- **Stop Loss:** For long trades, set the stop loss at the RED line below. For short trades, set it at the BLACK line above.
- **Take Profit:** For long trades, target the next RED line above. For short trades, target the next BLACK line below.
**Timeframe:**
Use a 5 timeframe for trading.
**Risk Disclaimer:**
This setup is for educational purposes. I'm not responsible for your gains or losses. Check the chart for more details.

Maruti | Long | Swing / BTSTMaruti is showing a good bullish momentum.
Price is trading above the Monthly Pivot and has now closed above the Weekly Pivot as well.
Good buying coming in from the lows.
A long option trade can be initiated till 11,500 level maximum which also coincides with 50 DEMA resistance.
SL will be the present days' low.

MARUTI has broken a resistanceWith a trendline support at the current level , MARUTI is ready to continue being bullish. A buy at the current level can give targets of 11330 , 11415+

MARUTI--Demand & Supply??This stock recently broken the demand zone consolidating.
if this demand acts as supply zone price fall continues downwards up to the previous resistance turns as support levels.
we have to look for buyside when price comes back to the support levels.
Price is consolidation now, if price manipulates to upside we will go for short and if price manipulates to downside will go for buying.
Its now in manipulation area, keep observing and enter when price tests this support areas.

Maruti - All time high crossed and retractedMaruti cross all time high in the month of 1st Aug 23, surpassing the price of 9976. since then stock has risen to 13680.00 and then fallen back to 10959.30.
This correction is good opportunity to buy Maruti at current levels to ride all-time-high wave.

MARUTINSE:MARUTI
One Can Enter Now !
Or Wait for Retest of the Trendline (BO) !
Or wait For better R:R ratio !
Note :
1.One Can Go long with a Strict SL below the Trendline or Swing Low.
2. R:R ratio should be 1 :2 minimum
3. Plan as per your RISK appetite and Money Management.
Disclaimer : You are responsible for your Profits and loss, Shared for Educational purpose

Shorted Maruti intradayMaruti is showing intraday weakness. Clear rejection level from Daily Pivot.
Target - 10,900

From April 2020 to Nov 2024 in 5 years Unrealised gain: +60k/- From April 2020 to Nov 2024 in 5 years
Unrealised gain: +60k/- , +120% gain
cmp: 51k/-
good that I bought at confirmation after forming a bullinsh engulfin from bottm

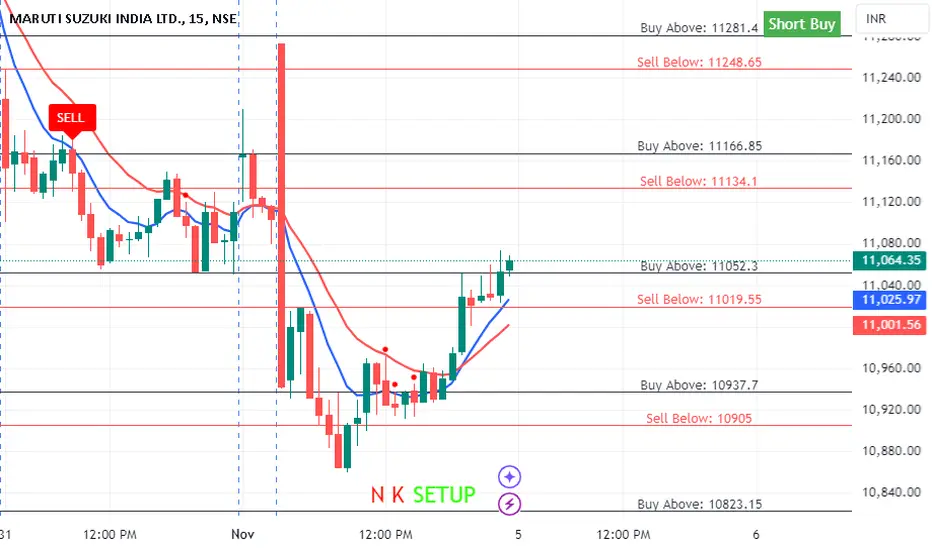
MARUTI KEY LEVELS FOR 06/11/2024**Explanation:**
This trading system helps you avoid blind trades by providing confirmation for better entries and exits. It considers volume, past prices, price range and indiavix.
**Entry/Exit Points:**
- **Entry/Exit Lines:** Use the BLACK line for long trades and the RED line for short trades, based on confirmation from your trading plan.
- **Stop Loss:** For long trades, set the stop loss at the RED line below. For short trades, set it at the BLACK line above.
- **Take Profit:** For long trades, target the next RED line above. For short trades, target the next BLACK line below.
**Timeframe:**
Use a 5 timeframe for trading.
**Risk Disclaimer:**
This setup is for educational purposes. I'm not responsible for your gains or losses. Check the chart for more details.

MARUTI KEY LEVELS FOR 05/11/2024//@description
// All credit goes to Tony for the concept of this indicator. His Trading View link: www.tradingview.com
// Note: The calculation method in this indicator differs from Tony's, but the concept is derived from his work.
**Explanation:**
This trading system helps you avoid blind trades by providing confirmation for better entries and exits. It considers volume, past prices, price range and indiavix.
**Entry/Exit Points:**
- **Entry/Exit Lines:** Use the BLACK line for long trades and the RED line for short trades, based on confirmation from your trading plan.
- **Stop Loss:** For long trades, set the stop loss at the RED line below. For short trades, set it at the BLACK line above.
- **Take Profit:** For long trades, target the next RED line above. For short trades, target the next BLACK line below.
**Timeframe:**
Use a 5 timeframe for trading.
**Risk Disclaimer:**
This setup is for educational purposes. I'm not responsible for your gains or losses. Check the chart for more details.
Alert:Maruti on Edge as Lower Highs Signal Looming Support breakWhen a stock 📉 consistently makes lower highs, it signals a weakening trend, with sellers taking control. Maruti is at major support suggests a critical level where the stock might break down further, potentially accelerating the decline 🚨. Investors watch these levels closely for exit signals, as breaking support can lead to sharp price drops 📉, driven by increased selling pressure and waning confidence in the stock's prospects. However, it may also bounce bank to make another lower low, continuing the bearish trend.
Daily close above 12500 is the key level to watch as it will tell us where the stock is headed.
Disclaimer: All ideas are my personal views and not financial advise. I do not have any Telegram channel nor do I sell any courses.

[Positional] Maruti SnR IdeaIf it hits stoploss, I will not close the trade but will deploy sphinx method.
Note -
One of the best forms of Price Action is to not try to predict at all. Instead of that, ACT on the price. So, this chart tells at "where" to act in "what direction. Unless it triggers, like, let's say the candle doesn't break the level which says "Buy if it breaks", You should not buy at all.
=======
I use shorthands for my trades.
"Positional" - means You can carry these positions and I do not see sharp volatility ahead. (I tally upcoming events and many small kinds of stuff to my own tiny capacity.)
"Intraday" -means You must close this position at any cost by the end of the day.
"Theta" , "Bounce" , "3BB" or "Entropy" - My own systems.
=======
I won't personally follow any rules. If I "think" (It is never gut feel. It is always some reason.) the trade is wrong, I may take reverse trade. I may carry forward an intraday position. What is meant here - You shouldn't follow me because I may miss updating. You should follow the system I share.
=======
Like -
Always follow a stop loss.
In the case of Intraday trades, it is mostly the "Day's High".
In the case of Positional trades, it is mostly the previous swings.
I do not use Stop Loss most of the time. But I manage my risk with options as I do most of the trades using derivatives

MARUTI: Awaiting Breakout with Key Levels in Focus
Bullish breakout above ₹12,562.85
Bearish breakout level: ₹12,103.60
Upside targets: ₹13,379.35 and ₹13,685.55
Support levels: ₹11,576.25 and ₹11,117.00

bullish on marutimaruti could show slight retracement in few days and then continue trend
levels are 13100 fib 0.23
then can touch till 13680 in october before earnings which is on mid october
can go long after slight retracement

Another stock from Auto sector - MarutiSame pattern as Escorts, have given breakout from consolidation.
13000+ targets are possible in this counter as well.

#MARUTI :NSEMARUTI is in a Consolidation Since March 2024 and has reached the bottom of the Channel, wait for Reversal Signal to Enter with 50%. quantity @12050. SL 11500.
Keep in Watchlist !

Maruti Long 11700 RR 1: 11 Target 15000Maruti
MTF Analysis
Maruti YearlyDemand DMIP 10932
Maruti 6 Month Demand BUFL 10932
Maruti Qtrly Demand BUFL 10932
Maruti Monthly Demand BUFL 11700
Maruti Weekly Consolidation Breakout 11700
ENTRY 11700
SL 11366
Target 15612
Last High 13656
RR 11.71

Maruti Suzuki: Symmetric Triangle Pattern and Key Levels 🔄 Symmetric Triangle pattern indicating possible breakout on either side
📈 Key resistance at 13,170 and 13,551
📉 Strong support levels at 11,884 and 11,200
Awaiting clear direction for potential trading opportunity
📊 Follow for analysis!

MARUTHI 15Mlet's see what happens
I Am Not SEBI Registered Analyst. All Post and Levels Posting is only for educational and knowledge purpose. I Am not responsible for your any kind of loss or profit.
No Claim, All Rights Reserved.‼️
