Mastek, Resistance, 1D LongMastek has crossed 2800 and made high of 2818, however it was unable to sustain it. If it crosses the level of 2800 with Bullish candlestick patterns like Bullish Engulfing, Hammer & Inverted Hammer, Piercing Line, Morning Star, Three White Soldiers, Tweezer Bottoms or Bullish Harami then we can see it going to fill FVG (Fair Value Gap) created previously upto 2950.
Entry above 2800
Target 1: 2850-2870
Target2: 2870-2920
MASTEK trade ideas

MASTEK SWING ANALYSISThanks for stopping by.
All analysis here is done strictly from an investor’s perspective — focusing on risk, return, valuation, and potential upside.
The notes cover key details. I’ve backed every thesis with my own analysis — no fluff, just what matters to investors.
If you find the idea useful or have suggestions, feel free to leave a comment. Always open to fresh insights.
Kind regards,
Psycho Trader

MASTEKMASTEK
watch above levels. green line is our entry, redline is our SL.
DISCLAIMER : I am NOT a SEBI registered advisor or a financial adviser. All the views are for educational purpose only.


MASTEK MID-TERM ANALYSISMASTEK is looking positive on charts , and once it crosses and sustains above 2691, then it can go up to 3475-3661. And on the downside, if it slips further, then the important support range on the downside would be 2315-2128. And levels for short covering on the downside to look for would be 1924. Also, keep an eye on imp short covering levels, which are less expected to come, which are 1699 and 1190.

Mastek: Monthly Rounding Bottom Breakout Opportunity!🚀 Mastek: Monthly Rounding Bottom Breakout Opportunity! 🚀
Current Market Price: 3257
Stop Loss: 2480
Target: 5160
Mastek is nearing a major monthly rounding bottom breakout above the 3320 closing level. A confirmed monthly close above this level could signal a strong upward trend, offering a promising investment opportunity. With the IT sector maintaining strong momentum, this stock looks well-positioned for potential growth.
📈 Strategy:
Create positions in a staggered manner to manage risk effectively.
Watch for the monthly close above 3320 to confirm the breakout.
📉 Disclaimer: As a non-SEBI registered analyst, I recommend conducting thorough research or seeking advice from financial professionals before making investment decisions.
#Mastek #TechnicalAnalysis #ITSector #BreakoutStrategy #RoundingBottom #InvestmentOpportunities #MarketMomentum

Price at Supply zoneGood volume buildup in daily as well as in weekly timeframe.
Long-term support from the trendline.
Fundamentals are OK.
DII stakes are up.
NOTE: I do my analysis, do yours before trade.
Eat🍜 Sleep😴 TradingView📈 Repeat 🔁

$mastekgoing up for sure
hanging on to the 7 ema for now
lets see if we get a tag of lower range
in this range since sep 21 so time to break bad

Rounding Bottom on MastekMastek came down with the fall in IT pack. It now has shown strength in the recent times and has formed a beautiful rounding bottom.
Can be studied for the pattern at current levels and looks good for 2700 initially and 3200 as a final target.

READY FOR BREAKOUT ON CUP & HANDLE PATTERN NSE:MASTEK trade @ 3000 level, Resistence is @ 3350 and Support @ 2550.
after a successful breakout you watch it as a next Resistence @ 4800-5000.


MASTEK S/R for 5/7/24Support and Resistance Levels: In technical analysis, support and resistance levels are significant price levels where buying or selling interest tends to be strong. They are identified based on previous price levels where the price has shown a tendency to reverse or find support.
Support levels are represented by the green line and green shade, indicating areas where buying interest may emerge to prevent further price decline.
Resistance levels are represented by the red line and red shade, indicating areas where selling pressure may arise to prevent further price increases. Traders often consider these levels as potential buying or selling opportunities.
Breakouts: Breakouts occur when the price convincingly moves above a resistance level (red shade) or below a support level (green shade). A bullish breakout above resistance suggests the potential for further price increases, while a bearish breakout below support suggests the potential for further price declines. Traders pay attention to these breakout signals as they may indicate the start of a new trend or significant price movement.
20 EMA: The yellow line denotes 20 EMA, to interpret the 20 EMA, you need to compare it with the prevailing stock price. If the stock price is below the 20 EMA, it signals a possible downtrend. But if the stock price is above the 20 EMA, it signals a possible uptrend.
Disclosure: I am not SEBI registered. The information provided here is for learning purposes only and should not be interpreted as financial advice. It is important to consult with a qualified financial advisor before making any investment decisions. Tweets neither advice nor endorsement.

BreakoutThere is the formation of a morning star pattern on daily chart today is a conformation candle also stock is about to cross its 200 DMA on the daily chart.

MASTEKThis stock breakout some consolidation level with good volume and major resistance level at 3400 if breaks this level further up move will come
This is only for educational purpose

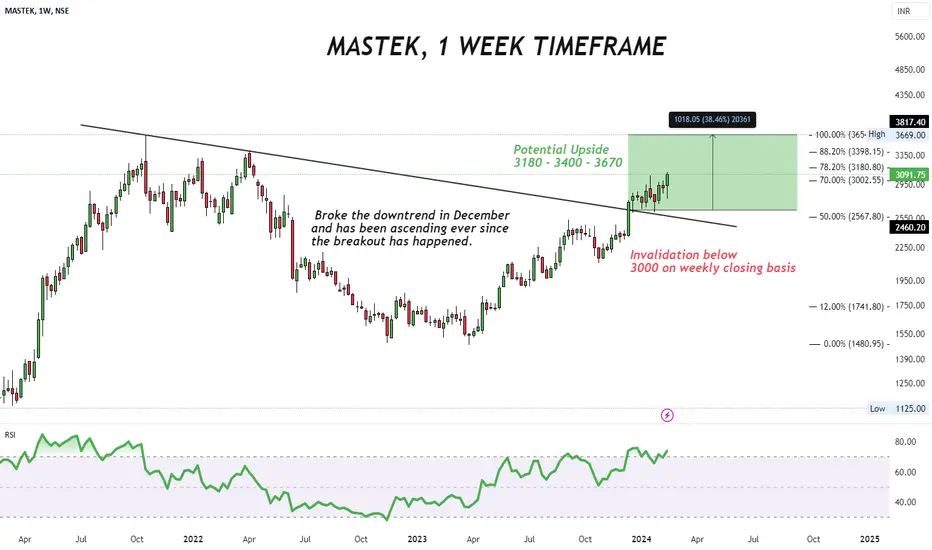
MASTEK TO NEW ALL TIME HIGH SOON?#MASTEK has broken out of the downtrend and now has been ascending for almost 2 and a half months and has almost come 15% off the breakout but the interesting this is that it closed above the local high and now looks ready for further ascension off there towards the previous all time high at 3669. Potential upside and invalidation are marked in the chart are just the fib retracement levels of the previous all time high and lows in 2022.
MASTEKPattern break out with gud volume supported by key MA. it may consolidate on this price range. be ready to buy on dip. Follow strict sl

BUY TODAY SELL TOMORROW for 5%DON’T HAVE TIME TO MANAGE YOUR TRADES?
- Take BTST trades at 3:25 pm every day
- Try to exit by taking 4-7% profit of each trade
- SL can also be maintained as closing below the low of the breakout candle
Now, why do I prefer BTST over swing trades? The primary reason is that I have observed that 90% of the stocks give most of the movement in just 1-2 days and the rest of the time they either consolidate or fall
Resistance Breakout in MASTEK
BUY TODAY SELL TOMORROW for 5%

💥Mastek💥-Nice Breakout💥Mastek💥-Nice Breakout
Capital to be deployed- 20k
Investing Price-2780-2790
Breakout Price-2766
Stoploss-2061
Targets-3914-4452-10405
RT for max reach
#mastek #stockstowatch #StocksToBuy #StocksInFocus #stocks #StockMarket

MastekStock name = Mastek Limited.
Weekly chart setup
Chart is self explanatory. Levels of breakout, possible up-moves (where stock may find resistances) and support (close below which, setup will be invalidated) are clearly defined.
Disclaimer: This is for demonstration and educational purpose only. this is not buying and selling recommendations. I am not SEBI registered. please consult your financial advisor before taking any trade.

MASTEK a long call Weekly chartas we have seen master gave a massive uptrend rally and than formed a m pattern. After a long consolidation Mastek has given a breakout of cup & handle pattern on weekly chart pattern.
Its a buy call but will be invalid below the 2342
CUP & HANDLE PATTERN
VOLUME BUILD UP

#Mastek | #StocktobuyGolden ratio reversal seen in the stock sustaining above 1890 will open the stock for 2085/2340 levels.


MASTEK BULLISH LONG-TERM INVESTMENT READYMASTEK turned bullish with double bottom at 0.618 fib...next target 3600 as first resistance if markets are positive .
best long term investment stock.8k within 2-3 years.
like and follow if analysis is helpful..more stock analysis will be released for long term investments.tq.
