Round bottom Resistance BreakoutPlease look into the chart for a detailed understanding.
Consider these for short-term & swing trades with 2% profit.
For BTST trades consider booking
target for 1% - 2%
For long-term trades look out for resistance drawn above closing.
Please consider these ideas for educational purpose
MASTEK trade ideas

Breakout happend.Breakout happend in this stock.
Keep your risk and reward ratio according to your preferance.
This is for educational purpose. Do your own research investing.

Near breakout.This stock is near breakout with rising 40 week moving average(200 day moving average).
Keep your risk and reward ratio according to your preferance.
This is for educational purpose. Do your own research before investing.

It may breakout.
Keep your risk and reward ratio according to your preferance.
This is for educational purpose. Do your own research before investing.

MASTEK - Bullish Consolidation BreakoutNSE: MASTEK is closing with a bullish consolidation breakout candle supported with volumes.
Today's volumes and candlestick formation indicates strong demand and stock should move to previous swing highs in the coming days.
The stock has been moving along the horizontal support for the past few days which is indicating demand.
One can look for a 8% to 12% gain on deployed capital in this swing trade.
The view is to be discarded in the event of the stock breaking previous swing low.
#NSEindia #Trading #StockMarketindia #Tradingview #SwingTrade
Disclaimer:
This is for educational purposes only.

TREND LINE SUPPORT FAKE BREAK DOWNBUY DELIVERY CALL
BUY MASTEK 1760 ADD MORE 1730 SL 1620 TARGET 2200
up trendline support with fake break down


MASTEK is an excellent buystock appears to have taken support in golden zone(50%-61.8%), where we have additional confluence of S1 PP and AVWAP....an excellent buy

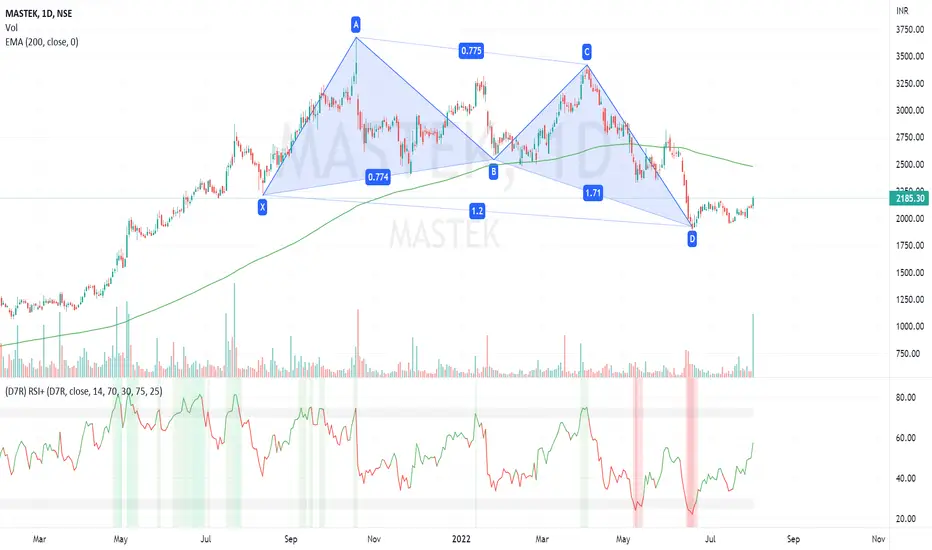
MASTEKMASTEK - Bullish butterfly pattern
The downside seems to have come to an end.
Target - 2477
SL - Today's low.
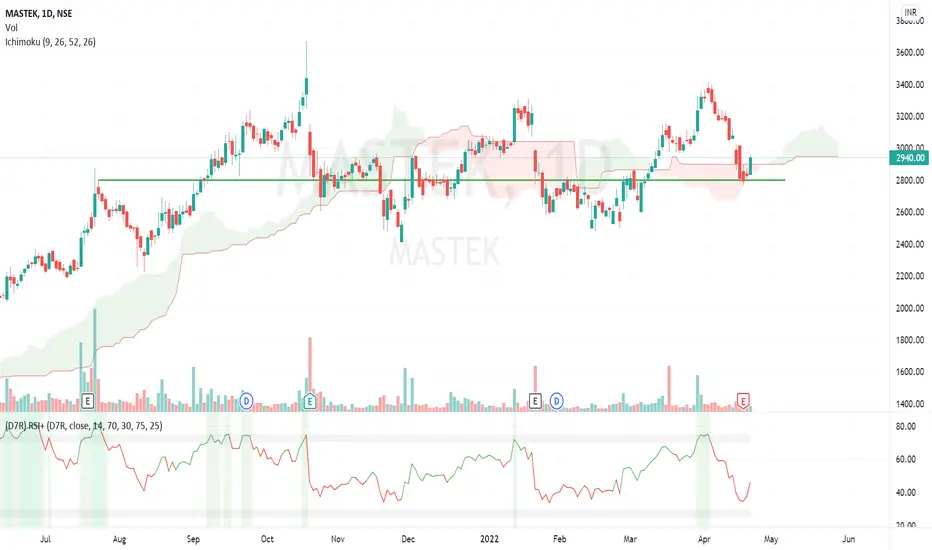
MASTEK - Mean reversion MASTEK - Mean reversion accompanied by Cloud support
Entry - Daily close above 2890
SL - 2800
Mastek IndiaSun Storm Investment Trading Desk & NexGen Wealth Management Service Present's: SSITD & NexGen Portfolio of the Week Series
Focus: Worldwide
By Sun Storm Investment Research & NexGen Wealth Management Service
A Profit & Solutions Strategy & Research
Trading | Investment | Stocks | ETF | Mutual Funds | Crypto | Bonds | Options | Dividend | Futures |
USA | Canada | UK | Germany | France | Italy | Rest of Europe | Mexico | India
Disclaimer: Sun Storm Investment and NexGen are not registered financial advisors, so please do your own research before trading & investing anything. This is information is for only research purposes not for actual trading & investing decision.
#debadipb #profitsolutions

Positional Buy MastekPositional Call Matek
Buy Mastek with stop loss 2497
Target 1 : 3260
Target 2: 3670
This stock is trading above 20,50,100,200 EMA

MastekMastek is it stock ,it has given breakout after consolidation, the probability is to go up to test next resistance.risk reward mentioned?for sort term Swing.


MASTEK LongMastek is a provider of vertically-focused enterprise technology solutions. Having its presence in IT industry for almost 4 decades, Mastek Ltd has evolved from an IT solutions provider to Digital transformation partner.
www.screener.in
Entry - 2750-2950 ( If Price retraces and retests the breakout, but momemtum looking strong so price may not retrace and just move up from 2930 levels.)
Target - 3600 or simply trail profit as this stock looks good for few years
SL - 2600 WCB

MASTEK LIMITEDThis chart is only for educational purposes and should not be considered for doing any buying and selling in this stock.

MastekGave breakout ,Making flag pattern ,after breakout,you can long.
good opportunity.keep in watch this stock👍🏻

MASTEK LIMITEDThis chart is only for educational purposes and should not be considered for doing any buying and selling in this stock.

An idea of Mastek reaching 2.7k by trend analysisAs its an uptrend, I have used the Trend line to draw an idea of the trend support and resistance as the normal support and resistance won't work in a satisfactory manner.
I used Bollinger Bands and RSI indicator suggesting that as it will go down to 50 and and hopefully come back
I hope it helps someone,
Disclaimer : All analysis are based on one person's idea or view. It can't assure 100% accuracy.

Short term cash Buy MASTEK 2100-2150 SL1970 TGT 2375,2600Stock price has broken out on the daily chart with higher volumes.
➢ Short term trend of the Stock is positive where it is trading above its 5,20 and 50-day EMA
➢ Oscillators like RSI and MFI is showing strength in the current uptrend
➢ Plus, DI is trading above -DI while ADX line is placed above 25 Indicating momentum in the current
uptrend
➢ TK cross over around 2050 and MACD cross over at 2070
➢ Considering the Technical evidences discussed above, we recommend buying Mastek at CMP of 2100-2150
and average at 2050 for the upside targets of 2375 and 2600, keeping a stop-loss at 1970

MASTEK LIMITEDThis chart is only for educational purposes and should not be considered for doing any buying and selling in this stock.

STOCK FOR INVESTMENT MASTEK LTD.Good evening friends, we are now sharing our view on mastek LTD for a long time we are of the opinion that if it is sustaining above 2000 level it can show good move.
We are not at all recommending it is our view only for educational purpose. For more details kindly watch the video
Regards.
