MCX Pole & Flag BreakoutMCX pole and flag breakout is on chart.
Levels marked on chart.
If you didn't take this trade but at least keep this in your watchlist to observe how this chart pattern work in real environments.
MCX trade ideas

MCX LONGBreakout from a rounding bottom pattern and also volume increase in past few days. On new highs.

MCX DAILY CHARTMCX DAILY CHART
Breakout @ 1698 Target 2250 Support 1650
MCX has witnessed a resistance breakout @ 1698 level, likely to head towards 2250 levels.
Its only an observation & not any suggestion.

Hedge Trade Strategy in $NSE:MCX
Dear Followers,
I hope you're doing well. I wanted to share a brief update regarding the short-term trend of the stock NSE:MCX I have been monitoring.
Currently, the stock is experiencing a downtrend in its short-term price movement. My analysis indicates that market conditions and recent price action suggest a period of declining prices. This information could potentially be useful for your investment / hedge strategy.
If Stock Break 2850-2840 level then possibly we can see 2730-2690 level so if you are ready to take Risk then I have 2 Strategies For Month Of November Series that we can Deploy.
1)Buying an Option
Strike Rate= 2760 PE
Buy Price= 21-22
Stop Loss= 13
Target = 30,35,43
Time Frame 4-6 Days
Investment = 8800
maximum Loss= 3600
Profit Upto = 8400
2) Hedge strategy
Stock Name- NSE:MCX1!
Future Entry Level - 2845
Future Stop Loss Level- 2900
Future Target Level- 2690
Option Level- Buy 2860 CE
Investment = 16500
Maximum Loss = 17000
Profit Upto = 63000
Best Regards,

MCX - Stock Analysis🚀 **Strategic Stock Pick: MCX - STWP View**
📈 **PriceVol**: *Bullish*
- *Last Few Sessions*: Rising Price Accompanied by Increasing Volume
🔥 **OneDay**: *Strong Bullish*
- *Latest Tick*: Vigorous Price Surge Supported by Strong Volume
📊 **Donchian Bands**: *Strong Bullish*
- *Trending Up*: Consecutive New Highs Indicate a Robust Uptrend
📈 **Daily Chart**: *Bullish*
- *Heikin Ashi Pattern*: Bullish Continuation Pattern Identified
📅 **Weekly Analysis**: *Bullish*
- *Heikin Ashi Pattern*: Bullish Continuation, Indicating Positive Momentum
🗓 **Monthly Outlook**: *Strong Bullish*
- *Candlestick Pattern*: Bullish Marubozu at a High Level, Suggesting Strong Momentum
🚀 **Trade Recommendation**:
- **Go Long above**: ₹2785
- **Stop Loss**: ₹2431
🌟 *Unlock the potential for substantial gains with MCX! Seize the opportunity and position yourself for success.*


Small risk and big profit expected (RSI based confirmation)Its hourly chart of MCX. Trend line rejection on last candle and RSI overbought also noted. Now we can see down side from here. Only one option can be possible according to me, market can hold on upper level. otherwise very big probability to move downside.

MCX - Stock AnalysisMulti Commodity Exchange of India Ltd. (MCX) is displaying a strong technical and fundamental profile, making it an attractive option for investors.
From a technical perspective, the stock exhibits several positive signals. The PriceVol indicator is "Mild Bullish," cautioning that while the price has been rising, the volume may not fully support this trend. The HighLow indicator is "Bullish," indicating that the stock has made a new one-year high.
The one-day analysis is "Mild Bullish," with the latest tick showing a mild price rise. It's advised to keep a close eye on the volume. The Parabolic SAR (PSAR) is "Bullish" with a bullish crossover and is sustaining the trend. The KeltnerBand, DonchianBand, MAEnvelopeBand, HighLowBand, MAChannelBand, RsiSmooth, ADX (Average Directional Index), and HighLowMABand all exhibit "Strong Bullish" signals, indicating positive breakouts and strong trends.
Candlestick patterns on the daily, weekly, and monthly charts all reflect "Bullish" sentiment, highlighting positive market sentiment.
From a fundamental perspective, MCX demonstrates several strengths. The company's Book Value has been trending upward over the last three years, indicating a strong financial position. There is excellent net margin performance over the last three years, reflecting healthy profitability. MCX is earning an excess return, and all key Trailing Twelve Months Margins have grown by 15%.
The Piotroski F Score is at a stable value of 4.0, suggesting sound financial health. The company maintains a good net margin of 23.10%, indicating strong profitability. However, it offers a very low dividend yield of 0.820%, indicating a preference for reinvesting profits for growth.
MCX has achieved annual sales growth for three consecutive years, and quarterly sales over the last five years are trending upward. Additionally, there is a steady increase in Total Assets over the last three years, reflecting the company's consistent growth and financial stability.
In summary, Multi Commodity Exchange of India Ltd. (MCX) presents an appealing investment opportunity with strong technical and fundamental indicators. The stock's bullish technical signals, combined with its robust financial performance, make it an attractive choice for investors seeking growth potential in the market. Nevertheless, investors should stay vigilant and monitor both technical and fundamental developments for a comprehensive understanding of the stock's potential.
Go Long above 2447.10
Stop Loss 2191
MCX for short time tradeAnalyse MCX for coming week in 15 minute candle pattern. This pattern is ABCD which make many time in chart.

MCX looking ready for the next up moveMCX is making an inverse head and shoulder pattern at 30 min timeframe. Trend is already bullish on 1D. Entry only after the break of structure

MCX These are swing ideas which you can add your watchlist and analysis for yourself !
Keep on your radar!
This content only education purpose!
I am not sebi ragister!

MCX ANALYSIS SWING-LONGPleasure to have you here. This is an investment analysis done for the Tickr, and potential in the Technicals.
In this Daily Chart , the chart has been slightly in uptrend and as soon as it crosses its resistance, we will decide to make a position in the stock,
if you like the idea please like the post :) It will be a motivation to further such ideas.
Disclaimer Note:-
1) This is just an analysis setup and no advice to trade/trade
2) If you are making position, please have your risk to reward analysis and then enter.
3) The analysis and target shared does not mean i trade in them, entry and exit depends on the market open and other factors.

Multi Commodity Exchange Ltd.*Multi Commodity Exchange Ltd*
*MCX*
C&H Formation on Decadal Basis.
RB Formation on Monthly Basis.
Price BreakOut Needed to be Sustained.
Resistance @2136 to be Watched.
Accumulation > Distribution, Continued BuiltUp To be Watched.
*Trail SL with Upside*
*Book Profit as per Risk Appetite*
Do Your Own Research as well. This is an Opinion.
Happy Investing 😇

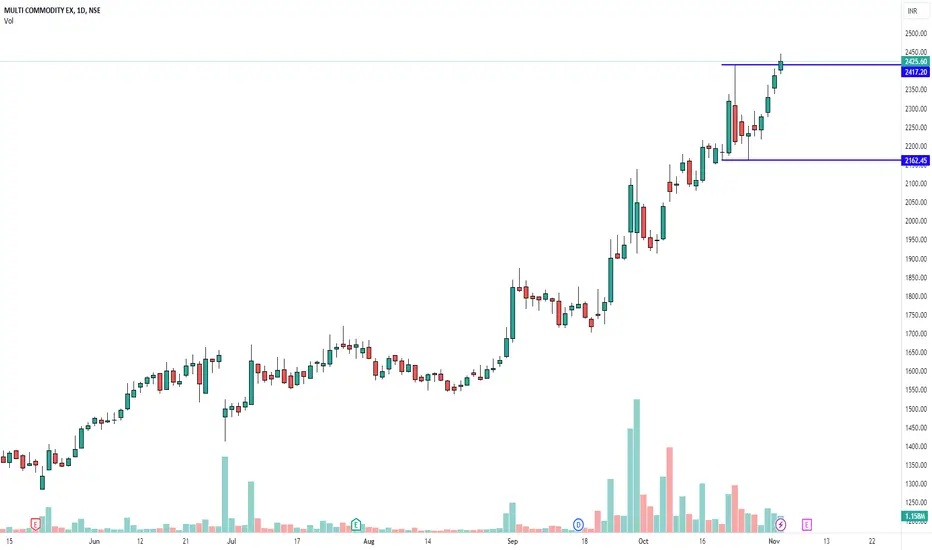
paisa doubleat a very crucial multi year breakout . wait for 2160 to be taken out convincingly & the stock will zoom to the skies

💥MCX Ltd💥- Nice Breakout💥MCX Ltd💥- Nice Breakout
Capital to be deployed- 20k
Investing Price -1870-1890
Breakout Price -1858
Stoploss-1706
Targets -2307-3981
RT for max reach.
#mcx #StocksToBuy #stockstowatch #stocks #StocksInFocus

Wedge Pattern Resistance BreakoutPlease look into the chart for a detailed understanding.
Consider these for short-term & swing trades with 2% profit.
For BTST trades consider booking
target for 1% - 2%
For long-term trades look out for resistance drawn above closing.
Please consider these ideas for educational purpose


#MCX... Looking good for 21.07.23#MCX...
Intraday as well as swing trade
All levels given in charts ...
IF good potential seen then we work in options also
if activate then possible a good movement Keep eye on this ...
We take trade only when it activates...
Possible to give good target
TRADING FACTS


MCX-NSE 15 Min setupThis set up works best for the MCX index chart on the-NSE 15 min or less timeframe.
Open the CCI indicator with a period of 50. MACD settings is as usual.
We buy only when the CCI 50 is above 0 and MACD cross over to the above has happened. We sell only when the CCI 50 is below 0 and MACD crossover to the below has happened.


MCX Buy Levels 18 May 2023As per my analysis, NSE:MCX is indicating reversal. My idea is to take buy entry at level of 1365 with stop loss of 1330. My expected upside target would be 1385 & 1465.
Note: This is my personal analysis, only to learn stock market behavior. Thanks.

MCX - Bullish Swing ReversalNSE: MCX is closing with a bullish swing reversal candle supported with volumes.
Today's volumes and candlestick formation indicates strong demand and stock should move to previous swing highs in the coming days.
The stock has been moving along the horizontal support for the past few days which is indicating demand.
One can look for a 8% to 12% gain on deployed capital in this swing trade.
The view is to be discarded in the event of the stock breaking previous swing low.
#NSEindia #Trading #StockMarketindia #Tradingview #SwingTrade
Disclaimer:
This is for educational purposes only.
