MCX Multi commodity exchange this stock is now trading in TRIANGLE pattern waiting for the clear breakout. This pattern is showing in 1hr time frame. Purely intraday strategy. This is not any call or recommendation this is my study purpose analysis.
MCX trade ideas

MCX - Ready for upmove MCX SCRIPT:
Mcx is breaking out of an important level
Stock in continuation bullish pattern
CMP Range 1635-1640
SL below 1590
Possible target 1950+
Time frame =2-4 months
- Trade Active

MCX MULTI COMMODITY INDEXMCX day chart
Support zone is 1425
Nearly resistance is swing high which is 1698
buy when price comes to near support zone 1430

MCXMcx broke out of falling trendline on 30 min TF with good volumes.
Could be bought with mentioned stoploss & target.

Wyckoff Phases in PracticeWe all know that market moves in Phases. The four most popular phases are –
1️⃣Accumulation
2️⃣Markup
3️⃣Distribution and
4️⃣Markdown
Mr. Wyckoff analyzed these phases further, esp . Accumulation and Distribution, to understand the price behavior for potential opportunities to trade/invest in the market.
In this tutorial I am going to have a brief discussion about Accumulation-sub-phases of the market with the help of an example that I came across today.
✅Phase A
🚩This phase is preceded by a major downtrend.
🚩Begins with a selling climax ( SC ) - Large down bars with abnormally high volume (see B).
🚩SC is followed by the largest rally in the major downtrend, associated with good buying volume . This Automatic Rally (AR) represents the change in character (ChoC) of the market - buyers taking over.
🚩Market retest the level B with a lower volume (supply) – Secondary Test (see D).
✅Phase B
🚩Usually the longest phase.
🚩Higher volume during rallies (eg. E) and lesser during retracements.
🚩Even if volume is high during retracements, price fails to make new lows.
🚩More secondary tests (see F) held at the support zone (B and D).
🚩Market consolidates testing supply and demand with no particular direction – Consolidation.
✅Phase C
🚩This phase is the smallest but the most important.
🚩Usually ends with a Spring (not in the above case).
🚩You would often see final shakeout of weak buyers in this phase. Price would dip underneath the support zone (B, D and F) and reverse sharply back above support.
🚩Perhaps the best time to enter for those who like to take low risk high probability trades.
🚩In the above case, point G was just another test of support Zone.
✅Phase D
🚩You would see swift action in this phase. Wide up bars (with high volume ) and small down bars (with low volume ) -Sign of Strength.
🚩This also represents the change in character, which now differs from the consolidation phase.
🚩ChoCh - Notice two blue rectangles and the price action in them. The action differs vehemently from the previous phases - wide bars with ease of movement.
🚩Price breaks the resistance zone (in most cases resistance would be the high of automatic rally).
🚩It again retests (after breakout) this resistance which now starts acting as support. This is called the Backup action.
🚩Further (re)accumulation can be seen here in many cases.
🚩This is perhaps the best time for those who like to enter after confirmation (A higher high; break of resistance; price jumping outside the range)
✅Phase E
🚀Accumulation is over and a trend is established - Markup phase
Not all bear markets end up with these accumulation-sub-phases. You may often see V-shaped recoveries just like what we experienced after March 2020 lows. But you will surely find some stocks or markets that moved in line with Wyckoff phases.
Thanks for reading.
Do like and comment.
📣Disclaimer: The views are personal only. Apply your own due diligence before making your investment decisions.

long for positive divergencelong for positive divergence. volume increasing in green candles, and low volume in red candles.

Long In MCXBuy MCX between 1375 to 1433 for a target of 1735. today it broken weekly triangle patter and moved almost 10%, so better wait for re-tracement.

#MCX Weekly TF#MCX MCX
#MCX MCX #MCX MCX #MCX MCX #MCX MCX #MCX MCX #MCX MCX #MCX MCX #MCX MCX #MCX MCX
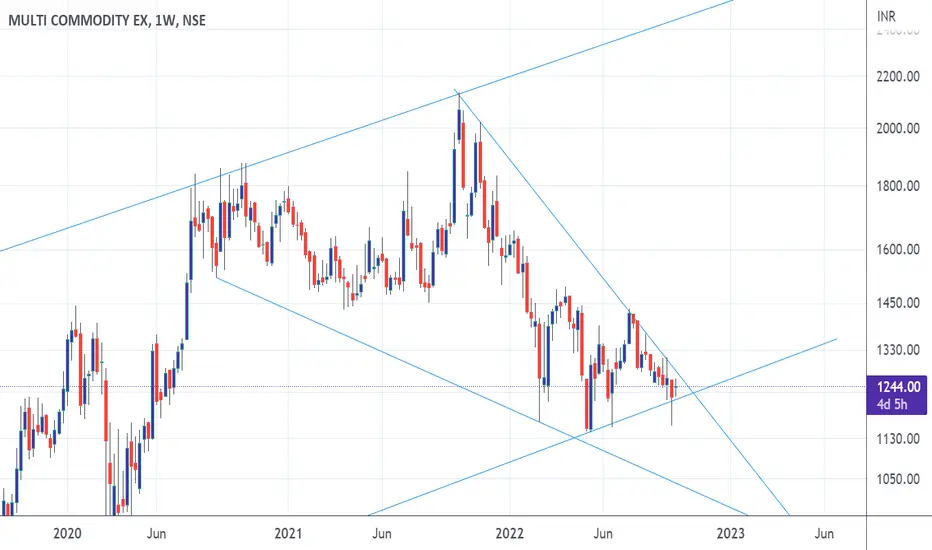
Go long/short on breakout of trendline on weekly time frame
mcx #MCXEducational purpose only
MCX #MCX mcx #mcx
MCX #MCX mcx #mcx
MCX #MCX mcx #mcx
MCX #MCX mcx #mcx

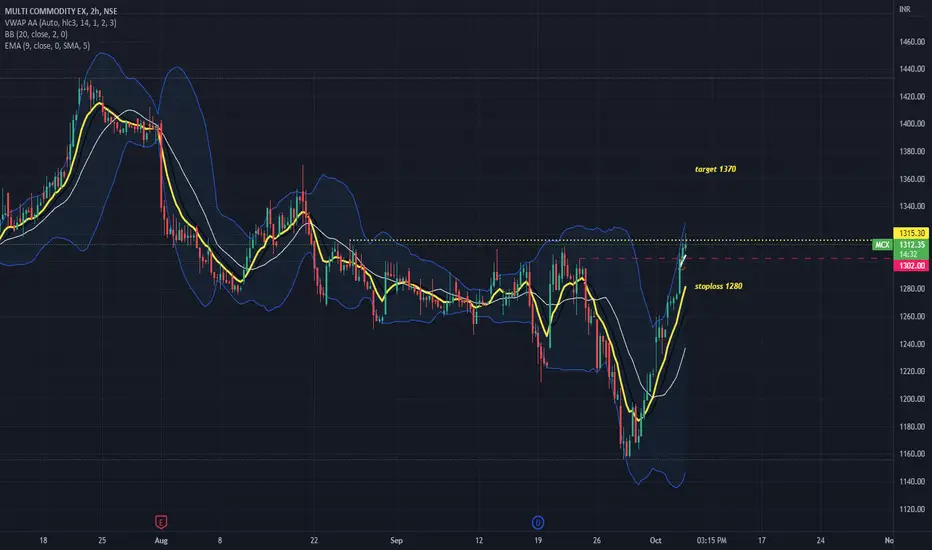
MCXMCX broke above multiple resistance zone of 1303-1313 & looks like its closing above resistance level with very good volumes.
Could be bought with mentioned stoploss & targets.
long mcx above 1444 we are long mcx above 1444 maintain sl below 1372 short term target-1655+ long term target - 2000+
risk - 72 points
rewards - 211 short term
rewards - 556 long term
always maintain risk to rewards

BreakOut Candidate MCX NeartermTarget Open 1500+
PE Ratio has fallen
Mutual Funds have increased holdings from 29.63% to 30.51% in Jun 2022 qtr.
FII/FPI have increased holdings from 26.52% to 26.84% in Jun 2022 qtr.
Institutional Investors have increased holdings from 74.85% to 75.44% in Jun 2022 qtr.

MCX - EW (auto generated) suggest good risk reward on longs hereSignificant correction (>40%) from the top for a monopoly platform name
Cheapest amongst the platform stories. Should be added to portfolio here and on dips

MCXTrade setup:
Weekly: Multi-year breakout (with cup & handle pattern), consolidation and breakout again (with bullish Marubozu candlestick & huge volumes). Crossed resistance @1880 INR approx. and sustained. One can also consider flag and pole breakout pattern. Trading above 50EMA and 200EMA (sloping upwards).
Entry = CMP ie; 1922 INR (any dip until 1780 INR is a buying opportunity).
SL = low of monthly candle ie; 1600 INR
Target = 2330 INR (T1) and 2510 INR (fib level)
RR = 1.0 for T1 and 1.8 for T2

small positionthis is also same trade idea like GRSE (previous trade)
chart is 15min delayed on trading view


MCX Holding Above 1385 Looks good for Breakout
MCX above 1385 can give good up-move minimum 1600++++ Levels
All Investment Banking & Securities stocks are on the radar for a long.


SHORT TERM POSITIONAL MCXMCX is given breakout on a larger time frame. MCX buy above 1401, CMP 1431. Target-1448, 1467, 1485,115,1537
SL below 1321 or 1355.
As MCX breakouts on smaller timeframe also, you can take position at CMP. If it falls till 1400, then accumulate in triangle pattern. After that wait for target or SL. Novice trader, please keep your position size small.

MCX LONG (Positional)Long - above 1400
If price came near 1400- 1410-1420 add quantities
Stoploss - 1350
Target - 1600 to 1640
Risk Reward - 1:3 to 1:4

MCX a Long OpportunityI was looking at MCX on the 1h TF and observe that price has crossed the cheap entry zone as per the ProTrader script. I have seen that on many occasions, when the levels are drawn, price attempts to reach at least the first marked level. I think this time also it will do so.
For the curious, the levels are based on Fibonacci sequence and are automatically plotted by the ProTrader script.
Let's see how it works out.

MCXMCX made butterfly pattern on daily chart with decent volumes,,
Could be bought with mentioned stoploss & targets.

MCX LONG Falling Wedge Pattern
With a target Price of 1835 and SL of 1348
Which is 27% Returns Which can expect in next 3 months time
Stock is in a great Key level
Stock is one of the largest holdings with DII
