Cup & handle breakout.MAHANAGAR GAS LTD ready for fresh move. Cup & handle breakout on this stock.
BREAKOUT = 1482
SL = 1424
Target = 1571
looking good on this price point. supported by awesome volume.
Don't lose more than your entry reason.
MGL trade ideas

"U" shape Pattern,we tried to capture the Full "U" shape pattern, in this trade. SL 5% & Target 19%. based on past rally

MGLGETTEX:NSE : MGL Is a good fundamental stock. and latest Q. profit check out all-time-high
> According to my analysis company has good future growth and also there are multiple sigh
> On the chart pattern we can see there are multi-year breakouts and now testing all-time high
levels of re-test
* value buying stock on re-test levels *

MGL Ltd MGL Ltd
CMP 1315
Multi Year Breakout Level Retested
Buy Some At 1123, Some At 1071, Some At 1042

Double bottom or a long term Bullish reversal !This study is an educational post, not a trade /investment recommendation.
What looks like a double bottom can reverse multi-year trend at times and provide great investment opportunities!

MGL*MGL* seems good for long term target of 1500/1800/1973. CMP 1260. SL below 1050 with Positive RSI.

TRIANGLE CORRECTION : ELLIOTT WAVE ANALYSIS TRIANGLE CORRECTION : ELLIOTT WAVE ANALYSIS
A triangle is a sideways movement that is associated with decreasing volume and volatility.
Guidelines
Triangles have 5 sides, Corrective structure labelled as ABCDE
Location :
a- Usually happens in wave B or wave 4
b- Wave D in triangle itself
c- If in second then 2 will be zigzag and this will happen in B of zigzag
d- X wave of Double Three correction and XX wave of Tripple Three
e- XX wave of Double Zigzag correction
f- Wave D in triangle itself
Subdivided into three (3-3-3-3-3)
Subdivision of ABCDE can be either ABC, wxy, or flat

MGL 6 Year old monthly trendline breakout F&O stock:-
MGL 6 year old monthly trendline breakout with huge spurt in volumes for swing target of 1373 and 1472.
Accurate trading


MGL above 270 for longMGL is looking good above 1270, box breakout after years of consolidation is nearing, if it breaks the box a solid move can be seen.
Note: Please consult your financial advisor before any investment.

MGL : CUP and Handle breakout in monthly/weekly time frame.MGL cup and handle pattern. Target shown in the chart.
Fundamental good
Note: Just for knowledge sharing purpose.

MGL - Bearish ViewMGL - Elliott Wave Count
this view not a 100% reliable to take trade. its just a tentative view based on the current market movement.
if the market breaks the channel and comes back inside then we can take short trade for the target near bottom trendline.
SL will the whatever the high made after the Trendline breakout.
Please note that this information is for educational purposes only, and it is crucial to trade with caution.
NSE:MGL NSE:MGLZ2023 BSE:MGL

Mgl bullish view It’s not an investment suggestion, sharing just for knowledge sharing purposes.
If it breaks this particular resistance level than it should rally up to the next resistance level.


#mgl - Evergreen stock - Excellent RR 1:4#mgl - Approaching BO. Risk reward 1:4
SL is defined.
PS : Only for learning purposes. Please consult your financial advisor before investing.


Multiple Support and Key Resistance LevelThe Mahanagar Gas Ltd (MGL) chart view on TradingView shows the price of MGL stock over the past few weeks. The chart shows that MGL has been in a downtrend, but has recently found support at around INR 1000.
There are a few key things to note on the chart:
Support and resistance levels: The chart shows two key support levels at around INR 1000 and INR 750. These levels are where the price has previously found support and bounced back. There is also a key resistance level at around INR 1200. This level is where the price has previously faced resistance and been rejected.
Moving averages: The chart shows two moving averages, a 50-period and a 200-period moving average. The 50-period moving average is currently above the 200-period moving average, which is a bullish sign.
Overall, the MGL chart is showing some bounce from bearis. The price has found support at a key level, but the 50-period moving average is below the 200-period moving average and the MACD on OBV indicator is showing a bullish crossover. This suggests that the price could be about to move higher.
Trading strategy:
Based on the chart, a possible trading strategy would be to buy MGL at the current price level, with a stop loss below INR 1150 and a take profit target at INR 1200. This would give a risk-reward ratio of 1:1.
It is important to note that this is just a possible trading strategy and is not financial advice. Always do your own research before making any trading decisions.
Additional notes:
The MGL chart view on TradingView is using a daily timeframe.
The volume indicator shows that the volume has been increasing recently. This is a bullish sign that suggests that there is more interest in buying MGL.
It is important to be aware of the risks involved in trading stocks. Stocks are volatile and their prices can fluctuate wildly.
Please note that this is just my opinion and is not financial advice. Always do your own research before making any trading decisions.

MGL looks bullishMGL has recently moved closer to its resistance level of 1125. Significant volume as the price approaching the level. It would be a high-probability trade if it breaks the resistance with volume and retraces back to its support level. We can enter the trade for 3.5 risk-to-reward ratio. Also, it goes unnoticeable that it has been forming a cup and handle pattern. RSI is above 60 on monthly and weekly time frames. It also crossed 60 on the daily time frame in the last trading session.
It crossed 50 EMA on the daily time frame and has been above 50 EMA on the weekly and monthly time frame.

#MGL - evergreen stock Expecting better set of results.
PS : Only for learning purpose. Please consult your financial adviser.

wedge pattern reversal in MGLMAHANAGAR GAS LTD
Key highlights: 💡⚡
📈On 1Day Time Frame Stock Showing Reversal of wedge Pattern .
📈 It can give movement upto the Reversal Final target of above 1130+.
📈There have chances of breakout of Resistance level too.
📈 After breakout of Resistance level this stock can gives strong upside rally upto above 1270+.
📈 Can Go short in this stock by placing a stop loss below 1044-.

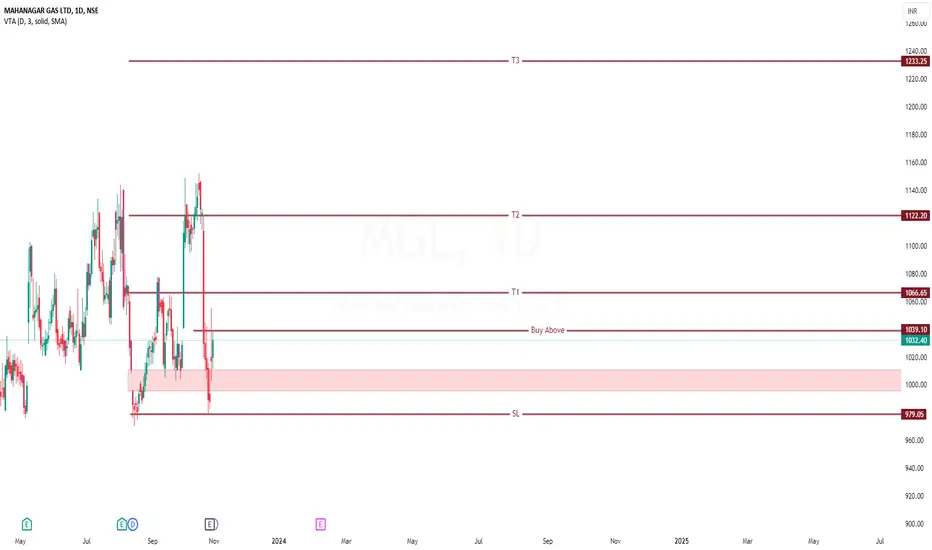
mgl buy @ 1075 target @ 1111, 1119, 1129 channel pattern breakomgl buy @ 1075 target @ 1111, 1119, 1129
channel pattern breakout
risk reward 1.5
sl@1038
