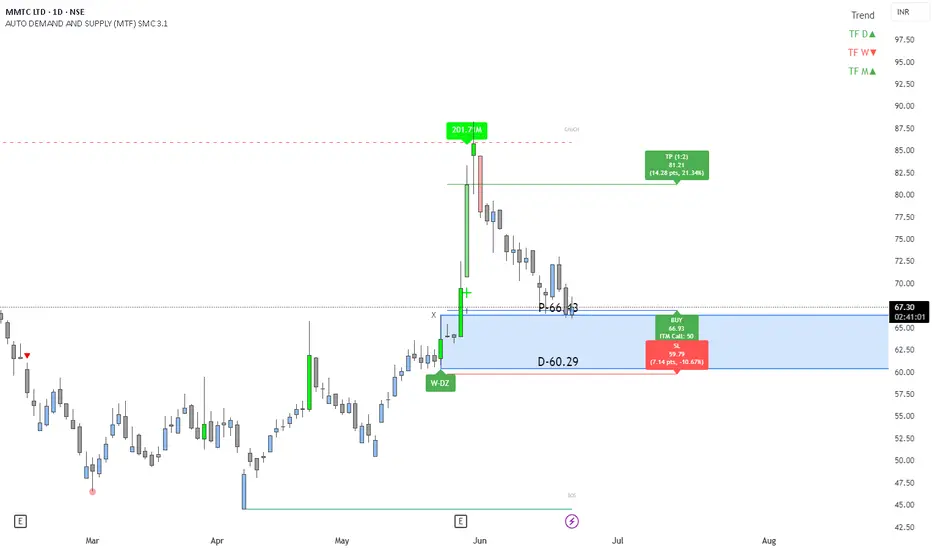
MMTC : Weekly Demand zone Long trade area market structurekey highlights : MMTC : Weekly Demand zone Long trade area market structure : Bullish Analysis Time frame :
Weekly proximal line - 66.43
distal line - 60.29
Buy entry - 66.90
Stop loss- 59.79
Target - 81.21
MMTC trade ideas
MMTC LTD Inverse H&S Breakout with Wave 3 PotentialMMTC is showcasing a clean Inverse Head & Shoulders breakout with price already retesting the neckline as support, followed by a strong bounce.
We’re now tracking Wave 3 development, with a projected target near ₹416.35, slightly above the classical H&S measured move.
The structure is well-defined and offers a favorable setup for both traders and positional investors.
Keep it on watch as momentum is building.

MMTC LOOKS GOOD FOR 80+Looks a downtrend reversal.
Good volume..
cmp71
target 80+
stop 65
psu stocks rallying..sector in a beariah trend for few months..
MMTC, a public sector undertaking, was incorporated in 1963, to facilitate foreign trade in India and canalize the export and import of essential minerals and metals. It is under the administrative control of the Ministry of Commerce & Industry, and Government of India and is engaged in trading across minerals, metals, precious metals, agro products, fertilizers & chemicals and coal & hydrocarbons.

MMTCPositional / Swing Trade opportunity in MMTC
CMP: 72.80
ENTRY: From 68-71
SL: 60
Target 1: 85
Target 2: 120
DISCLAIMER: Not Financial Advice. Only for Educational Purposes.
Invest at your own risk

MMTC LONGMMTC LONG
After Long Time RSI Cross Above 60
Price Close Above EMA
Volume Spike
Buy :- 85.15
SL :- 78.60
Target :- 90 / 94 / 98 / 104 / 111

MMTC : classical round bottom MMTC has formed classical round bottom
you can wait till break out or start buying with relatively small SL
buy above 102
Target 125, 150
SL 95
This is strictly for educational purpose.

MMTC Non Profitable PSU showing MULTI-YEAR BreakoutNSE:MMTC
......................................................................................................................
......................................................................................................................
As A Research Analyst ... It is Not an Good Practice to Suggest anyone to invest in Non-Profitable and Loss Making Company....
Every Fundamental Numbers are Either Negative or Not-Satisfying .......
but if we See in Terms of Technical Analysis....
MMTC is Showing Long-Multi-Year Breakout....
so Going with Defined Risk... keeping an Decent Percentage of SL ...
......................................................................................................................
......................................................................................................................
MMTC, a public sector undertaking, was incorporated in 1963, to facilitate foreign trade in India and canalize the export and import of essential minerals and metals. It is under the administrative control of the Ministry of Commerce & Industry, and Government of India and is engaged in trading across minerals, metals, precious metals, agro products, fertilizers & chemicals and coal & hydrocarbons.

MMTC Multibagger stocksMMTC Possible upcoming years multibagger stock minimum target possible 119-147-189 what to say about MMTC ?? cmp.60.40

MMTC - Strong Bullish Momentum (Buy & Hold)Technical Analysis of MMTC
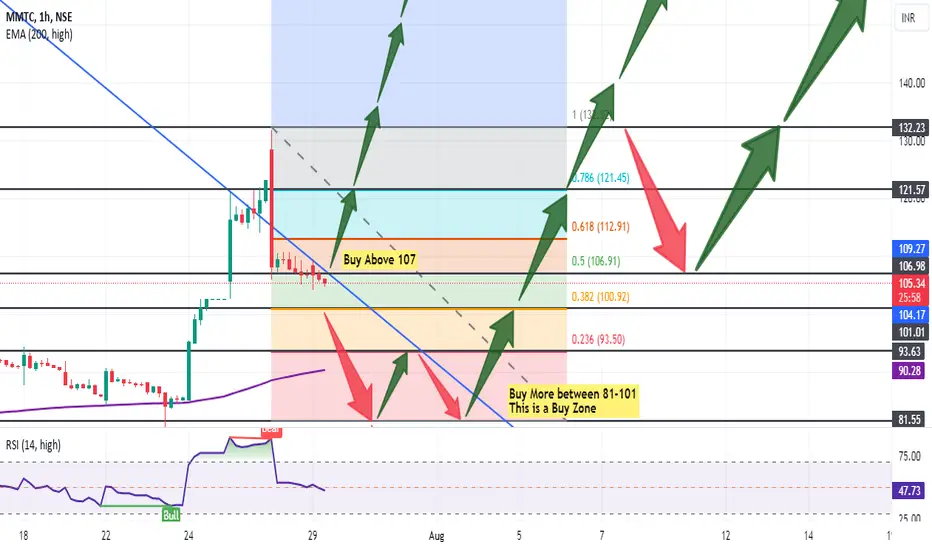
Overview of the Stock - The chart presents a technical analysis of MMTC on a 1-hour timeframe. It employs several tools and indicators to assess the stock's potential movement.
Key Indicators and Observations
Price Action: The price has been in an uptrend, with higher highs and higher lows. However, it appears to be facing resistance near the 107 level.
Moving Averages: - The EMA (200, high) is below the current price, suggesting an overall bullish trend.
Fibonacci Retracement: - The price is currently around the 0.5 Fibonacci level, which is often considered a significant support or resistance area.
Support and Resistance: The chart identifies potential support zones between 81 and 101, and a resistance level near 107 also mentioned on the chart
RSI (Relative Strength Index): The RSI is around 47, indicating a neutral to slightly oversold condition.
Buy Signal - The analyst has marked a potential "Buy Zone" between the price levels of 81 and 101 . This suggests that buying opportunities may arise within this range. Additionally, my recommendation to "Buy Above 107" indicates a potential breakout level.
Interpretation
Based on the provided chart, the overall sentiment for MMTC appears bullish . The uptrend, support levels, and potential buy zones suggest opportunities for upward price movement.
However, it's crucial to monitor the price action closely, as it approaches the 107 resistance level. A breakout above this level could signal further bullish momentum.
Important Considerations:
Timeframe: The analysis is based on a 1-hour timeframe. Different timeframes can provide varying perspectives.
Other Indicators: The chart only includes a limited set of indicators. Additional technical analysis tools could offer further insights.
Fundamental Analysis: Technical analysis should be complemented with fundamental analysis to make well-rounded investment decisions.
Further Analysis: - To gain a deeper understanding of MMTC's potential, consider:
Analyzing longer-term charts (daily, weekly)
Incorporating additional technical indicators (e.g., MACD, Bollinger Bands)
Evaluating the company's financial performance and industry trends.
Remember, past performance is not indicative of future results.
Disclaimer: This analysis is based solely on the provided chart and does not constitute financial advice. Always conduct thorough research and consider consulting with a financial advisor before making investment decisions as I am not SEBI registered person and this is my personal opinion about the stock
Thanks for your support as always
MMTC Long term trading IdeaAs we can see stock breakout its darvas Box from long consolidation time correction is already happened in this stock. the stock list in 1300 in 2010 now it went as low as 10rs almost 99% corrected from its peak which is 1300 levels. now company is cleared its debts.
now come to the fundamentals part the stock PE is 78 fall from 177.now it is trade on it median
although quarterly sales and profits are significantly drop from march 2022 but from march 2023 stock change its trend you can analyze the chart on multiple time frame for better undegrading what i traying to say.
if we talk about the technical, stock making higher high from December 2023 with a hug trading volume. bullish crossover in December 2023 RSI is also above 60 on week, day, and month chart it clearly show that stock is in power mode. on 1hr chart stock make a marubuzu candlestick with good trade volume.
stock is for high gain high risk not for safe player
stock can pickup its momentum again but as i always says do your complete research consult your financial advisor before making any investment decision
Educational Content
This stock analysis is designed for educational purposes and should not be taken as professional financial advice. Please carry out your own research or consult with a financial advisor before investing.

MMTC-Nice BreakoutMMTC-Nice Breakout
Capital to be deployed -20k
Investing Price -95-100
Breakout Price -94
Stoploss -77
Targets -202
#mmtc #StockMarketindia #StockToWatch #StocksInFocus #stockstowatch #StocksToTrade

MMTC multiyear breakoutfrom 2014 stock below level 70
now with volume breakout given
hold for longer target

MMTC - Strongly Buy & Hold - Ready to ExplodeMMTC Technical Analysis :- As per previous chart history and chart pattern along with my technical understanding at present MMTC is showing mixed technical signals. But my personal opinion about this stock is that this is a PSU stock and still undervalued and you can Buy this stock at CMP@79.31 or wait for a dip to enter in the market
I am strongly Bullish in this stock as this is my personal opinion and I am not suggesting any one to buy this stock because I am not SEBI registered person right now
My Overview:- Their overall technical rating is buy, with short-term (1 week) indicators leaning bullish. However, their oscillator ratings suggest the stock might be overbought in the near term. My analysis is positive, indicating an uptrend and bullish momentum
All points are mentioned on the chart
Important to Consider: - Technical analysis is just one piece of the puzzle. You should also consider fundamental factors and your own investment goals before making any decisions. Technical indicators can be subjective and prone to misinterpretation.
I recommend doing your own research and consulting with a financial advisor before making any investment decisions.
Thanks for your support as always


MMTC DOUBLE BRAKEOUT ON DAILY CHARTNSE:MMTC
MMTC Gives brake out on daily chart.
Buy Near 80
Sl 72
Target 98
Time duration 1 month
Risk Reward Ratio ---- 1 : 2
Profit on capital Ratio ---- 20%+

MMTC Hammer!MMTC is looking good for a reversal and hold for the target of 80-85. If it breaks the resistance then we can expect a new rally for 100+
Keep your
NOTE: Study before investing into the stocks.

Inverted Head & Shoulder BreakoutThe stock has experienced an inverted head and shoulders breakout over a period of ten years. Buy for Target of 129/290/590/1190

MMTCMulti-year range breakout. Watchout for overbought RSI levels around 80 which may lead to some cooling off consolidation but apart from that no resistance on the upside till 2x.
Disclaimer: Intended for educational purpose only and it's not a buy or sell recommendation.

10 Years breakout good potential small cap stockMMTC trading at 74.90 which gave a range breakout of 10 years and it's looks good for long after give retracement near 64.60.
TGT 1 : 105
Note: I'm not SEBI registered. Consult your financial adviser before take a trade.

MMTCMMTC is hovering around it's multi-year breakout zone. Above 72 it can bring another milestone of 100-120. Other scenario, it can consolidate for a week or two after breakout.

MMTC - 10 yr saturation breakout4th of 8 stock of Feb
It has break 10 years of saturation. We can expect a good move in MMTC

Trying to break 10 year resistance - Good momentum10 yr Resistance breakout lets wait for it to close above resistance zone then we can enter or in retest we can enter. We can see good momentum

MMTC channel Breakout MMTC channel breakout, can expect to go up till 90, where there can be another resistance
