motherson can fall from here Bearish trend will start and can find support close to 87 levels. so its good time to sell
Sell 97.7
sl 102
target 87
MOTHERSON trade ideas

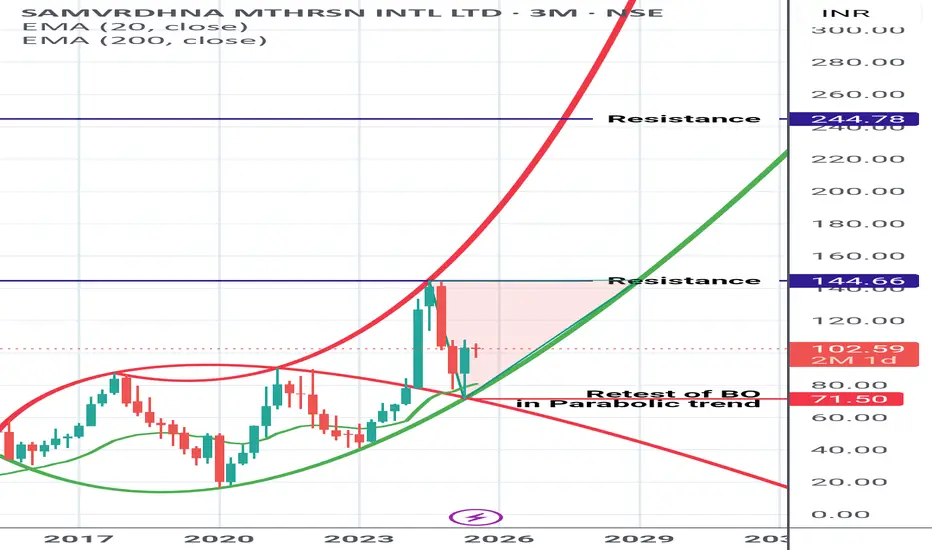
Samvardhna Motherson Getting ready Samvardhna Motherson
Earlier mentioned about Elliptical Pattern Breakout and the Rally in it .
Currently retesting the Parabolic trend support and trading inside the Triangular zone.
View is : Slowly getting ready for big rally. Stay invested.
Purely based on My STUDY . Lets see how it works.
Don't get biased by my views.
I may be wrong too.
Always do your own research.
Shared it for Reference purpose
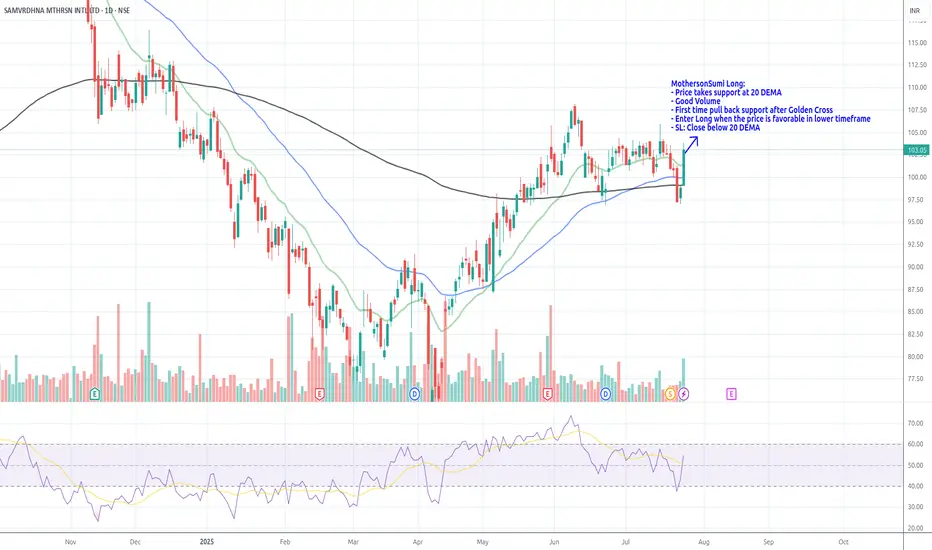
MothersonSumi Long_Support @ 20 DEMAMothersonSumi Long:
- Price takes support at 20 DEMA
- Good Volume
- First time pull back support after Golden Cross
- Enter Long when the price is favorable in lower timeframe
- SL: Close below 20 DEMA
Samvardhana Motherson Good to buySamvardhana Motherson International Ltd (153 ) is in uptrend. Expected Target 187. Stock is trading at 28.8 of its FY26 EPS and have ROE @23.46 and ROCE @ 13.96 and maintains a health dividend of 0.56. So We find this as undervalued at current price and has potential to move to target with support at 142.

Motheroson Buy in Cash"A weekly W-type pattern has already formed with a successful breakout above the neckline. Positive RSI divergence and support at the 61.8% Fibonacci retracement from the previous upmove further reinforce the bullish outlook. Any dips can be considered as buying opportunities."

MOTHERSON – Strong Setup After 50% Correction A Portfolio-Worth🚘 MOTHERSON – Strong Setup After 50% Correction | A Portfolio-Worthy Opportunity
🧭 Stock Overview & Why It Caught My Eye
Samvardhana Motherson International Ltd (commonly known as MOTHERSON) is one of the most consistent performers in the auto components sector — a stock that truly deserves a place in any serious portfolio.
🔹 The stock has undergone a ~50% correction from its all-time high, offering value.
🔹 Price recently tapped a key Monthly POI (Point of Interest) — a zone known for high institutional activity.
🔹 It formed a Higher High on the daily timeframe, confirming early trend reversal signs.
🔹 For the last 9 trading sessions, price has been consolidating between ₹131.40 and ₹139.50, preparing for a potential breakout.
🔍 Technical Rationale
Monthly POI + Consolidation is a powerful combination.
The recent Higher High structure indicates strength.
A breakout above ₹140.40 could trigger fresh bullish momentum.
Stop-Loss is tightly defined just below the consolidation range, giving a favorable risk-reward setup.
🧠 What Makes This Setup Special?
Smart Money Activity Likely – Price tapped a long-term POI and started building a base.
Volatility Shakeout Done – The consolidation likely cleared weak hands.
Now Setup is Cleaner – A breakout now would signal trend continuation.
🎯 Trade Setup & Plan
Trade Element Level/Range
Entry Zone On breakout above ₹140.40
Stop-Loss ₹130.60 (below consolidation low)
Target 1 ₹151
Target 2 ₹160
Target 3 ₹170++ (longer term projection)
⚠️ Note: Around the ₹161.80 zone, price may again consolidate or pull back. We’ll reassess trade management near that level.
🗣️ Final Thoughts & Notes
Missed the ₹120–₹118 zone entry due to market volatility — but the opportunity is still alive. The current structure gives a fresh chance to ride the next wave if the breakout confirms.
This is a textbook breakout setup from value zone + clean structure + well-defined stop-loss.
📢 Don’t Miss Out!
✅ Follow me to stay ahead of the market with real-time trade ideas.
👍 Drop a like if you found this useful & comment your view or analysis!
💬 Let’s discuss in the comment section — see you there! 🚀📊
🙏 Thanks for your continued support. Let's grow together, one trade at a time!


Motherson updated chart Motherson updated chart . looking good for up side as chances to reverse the price from the marked zone ... will see the result..

Motherson further correction possible to form Cypher / SharkMotherson is in the direction to form Cypher / Shark pattern.
It has potential to reach till 120 levels on downside.
Levels to follow as below,
Target: 151 / 140 / 130 / 120

Motherson.. ViewDocumented the View on Motherson for Long term holdings.
It consolidated for 4 months before giving 92% movement ..Now resting and coming down.
It is better to wait for the level to cross or come to base level and then accumulate for long term holdings.

MOTHERSON Poised for a New Leg Up!Motherson Sumi is flashing bullish signals, setting the stage for a potential breakout. Recent activity reveals strong volume, a key indicator of growing momentum and trader interest. Here's why the chart looks exciting:
Technical Insights:
1️⃣ Volume Surge: The significant uptick in volume highlights heavy buying interest, often a precursor to a strong upward move.
2️⃣ Trendline Breakout: Price action is hovering near a key resistance level, with signs of breaking out into a fresh bullish trend.
3️⃣ RSI Strength: Relative Strength Index shows upward movement, confirming bullish momentum without being overbought.
4️⃣ Moving Averages: Trading above the 20-day and 50-day moving averages, signaling sustained strength.
What to Watch For:
Key Resistance Levels: If it clears the resistance zone, it could unlock a substantial rally.
Support Holding: Strong demand near the support zone ensures the risk is well-contained.
Are you ready to ride the wave? 🌊 🚀 Drop your targets below! 📉

MOTHERSON looking For breakoutHello,
Trend-Based Analysis. Buy the Dips, Sell The Rallies, Also Following the Trend. Let's see where the Price Action takes us, Riding the wave. Potential trade setups based on trend momentum.
Technical analysis based on trend identification and momentum, Looking for high-probability setups within the prevailing trend.
Analyzing the current market trend and potential future price movement. Focusing on risk management and reward-to-risk ratios.
Details is Mentioned in Chart, Read carefully.. .
MOTHERSON swing tradeHello,
Trend-Based Analysis. Buy the Dips, Sell The Rallies, Also Following the Trend. Let's see where the Price Action takes us, Riding the wave. Potential trade setups based on trend momentum.
Technical analysis based on trend identification and momentum, Looking for high-probability setups within the prevailing trend.
Analyzing the current market trend and potential future price movement. Focusing on risk management and reward-to-risk ratios.
Details is Mentioned in Chart, Read carefully.. .

NEXT TO PERFECT ENTRY IF CLOSED ABOVE 169 IN MOTHERSONEverything is pretty much explained in the picture itself.
I am Abhishek Srivastava | SEBI-Certified Research and Equity Derivative Analyst from Delhi with 4+ years of experience.
I focus on simplifying equity markets through technical analysis. On Trading View, I share easy-to-understand insights to help traders and investors make better decisions.
Kindly check my older shared stock results on my profile to make a firm decision to invest in this.
For any query kindly dm.
Thank you and invest wisely.

MOTHERSON 1D TFNSE:MOTHERSON has formed a inverted flag and pole pattern. Once it breaks out with good volume and strong candle the stock could be traded.
Disclaimer:- This analysis is only for educational purpose. Please always do your own analysis or consult with your financial advisor before taking any kind of trades

LONG SETUP IN MOTHERSON#Motherson (SPOT)
Long trade setup
Entry: Above 168
Stoploss: 159
Targets: 180 / 190 / 200 / 210

Motherson Analysis and projectionI have analysed Motherson with the help of Gann price and time. I have considered the range. Stoploss is 176 and target is Apple.

2025 to 2024 nov, unrealized return is +50k/- with +78% returnat Nov 2024, cmp: 176 qnty:655
From 2025 to 2024 nov, unrealised return is +50k/- with +78% return so far 10% CAGR
Total investment: 64K/-
After that the stcok also fallen -60% :( from my buying price, I thought of selling the stock, but did not sold.
Now its giving around 15% CAGR in 9 years from 2015 to 2024 (excluding 2:4 stock split)
This stock is cyclical in nature, so exit on Nov 2024 and buy back around 100/- share price (-36% doen from current 176/-)

Diwali Muhurat Trading Pick - Samvat 2081 - Sector BaseMUHURAT TRADING PICKS
SAMVANT 2081
AUTO SECTOR
📊 Script - MOTHERSON
⏱️ C.M.P 📑💰- 181.15
🟢 Target 🎯🏆 - 216
🔵 Target % 🎯 - 16.13
📊 Script - TATAMOTORS
⏱️ C.M.P 📑💰- 835.25
🟢 Target 🎯🏆 - 1040
🔵 Target % 🎯 - 19.69
📊 Script - APOLLOTYRE
⏱️ C.M.P 📑💰- 502
🟢 Target 🎯🏆 - 615
🔵 Target % 🎯 - 18.37
POWER SECTOR
📊 Script - POWERGRID
⏱️ C.M.P 📑💰- 320.8
🟢 Target 🎯🏆 - 383
🔵 Target % 🎯 - 16.24
📊 Script - JSWENERGY
⏱️ C.M.P 📑💰- 679.8
🟢 Target 🎯🏆 - 804
🔵 Target % 🎯 - 15.45
FINANCIAL SECTOR
📊 Script - PFC
⏱️ C.M.P 📑💰- 455.2
🟢 Target 🎯🏆 - 536
🔵 Target % 🎯 - 15.07
📊 Script - HUDCO
⏱️ C.M.P 📑💰- 217.19
🟢 Target 🎯🏆 - 272
🔵 Target % 🎯 - 20.15
📊 Script - PTC
⏱️ C.M.P 📑💰- 182.5
🟢 Target 🎯🏆 - 215
🔵 Target % 🎯 - 15.12
FMCG SECTOR
📊 Script - VBL
⏱️ C.M.P 📑💰- 600
🟢 Target 🎯🏆 - 702
🔵 Target % 🎯 - 14.53
📊 Script - DODLA
⏱️ C.M.P 📑💰- 1181.2
🟢 Target 🎯🏆 - 1384
🔵 Target % 🎯 - 14.65
📊 Script - RADICO
⏱️ C.M.P 📑💰- 2379
🟢 Target 🎯🏆 - 2569
🔵 Target % 🎯 - 7.40
IT SECTOR
📊 Script - NEWGEN
⏱️ C.M.P 📑💰- 1285
🟢 Target 🎯🏆 - 1405
🔵 Target % 🎯 - 8.54
📊 Script - CIGNITITEC
⏱️ C.M.P 📑💰- 1414
🟢 Target 🎯🏆 - 1552
🔵 Target % 🎯 - 8.89
📊 Script - MPHASIS
⏱️ C.M.P 📑💰- 2883.5
🟢 Target 🎯🏆 - 3283
🔵 Target % 🎯 - 12.17
METAL SECTOR
📊 Script - JINDALSAW
⏱️ C.M.P 📑💰- 316
🟢 Target 🎯🏆 - 354
🔵 Target % 🎯 - 10.73
📊 Script - JSL
⏱️ C.M.P 📑💰- 672.3
🟢 Target 🎯🏆 - 766
🔵 Target % 🎯 - 12.23
📊 Script - WELCORP
⏱️ C.M.P 📑💰- 728.65
🟢 Target 🎯🏆 - 794
🔵 Target % 🎯 - 8.23
📊 Script - HINDZINC
⏱️ C.M.P 📑💰- 557
🟢 Target 🎯🏆 - 641
🔵 Target % 🎯 - 13.10
REFINERIES SECTOR
📊 Script - HINDPETRO
⏱️ C.M.P 📑💰- 382
🟢 Target 🎯🏆 - 424
🔵 Target % 🎯 - 9.91
📊 Script - IOC
⏱️ C.M.P 📑💰- 142.89
🟢 Target 🎯🏆 - 161
🔵 Target % 🎯 - 11.25
📊 Script - CHENNPETRO
⏱️ C.M.P 📑💰- 640.7
🟢 Target 🎯🏆 - 734
🔵 Target % 🎯 - 12.71
PHARMA SECTOR
📊 Script - AJANTPHARM
⏱️ C.M.P 📑💰- 3052.55
🟢 Target 🎯🏆 - 3253
🔵 Target % 🎯 - 6.16
📊 Script - MARKSANS
⏱️ C.M.P 📑💰- 290.25
🟢 Target 🎯🏆 - 313
🔵 Target % 🎯 - 7.27
📊 Script - PPLPHARMA
⏱️ C.M.P 📑💰- 268
🟢 Target 🎯🏆 - 300
🔵 Target % 🎯 - 10.67
REALITY SECTOR
📊 Script - OBEROIRLTY
⏱️ C.M.P 📑💰- 1980
🟢 Target 🎯🏆 - 2225
🔵 Target % 🎯 - 11.01
📊 Script - GODREJPROP
⏱️ C.M.P 📑💰- 2883.5
🟢 Target 🎯🏆 - 3198
🔵 Target % 🎯 - 9.83
📊 Script - ANANTRAJ
⏱️ C.M.P 📑💰- 740
🟢 Target 🎯🏆 - 761
🔵 Target % 🎯 - 2.76
HOTELS AND RESTAURANTS SECTOR
📊 Script - INDHOTEL
⏱️ C.M.P 📑💰- 676.3
🟢 Target 🎯🏆 - 750
🔵 Target % 🎯 - 9.83
📊 Script - CHALET
⏱️ C.M.P 📑💰- 870
🟢 Target 🎯🏆 - 973
🔵 Target % 🎯 - 10.59
THESE PICKS ARE FOR PURLY LONG TERM
⚠️ Important: Always maintain your Risk & Reward Ratio.
✅Like and follow to never miss a new idea!✅
Disclaimer: I am not SEBI Registered Advisor. My posts are purely for training and educational purposes.
HAPPY DIWALI AND PROSPEROUS NEW YEAR 🎆🧨
Eat🍜 Sleep😴 TradingView📈 Repeat 🔁
Happy learning with trading. Cheers!🥂

50 SMA Rising- Positional TradeDisclaimer: I am not a Sebi registered adviser.
This Idea is publish purely for educational purpose only before investing in any stocks please take advise from your financial adviser.
Its 50 SMA Rising Strategy. Suitable for Positional Trading Initial Stop loss lowest of last 2 candles and keep trailing with 50 days SMA if price close below 50 SMA then Exit or be in the trade some time trade can go for several months.
Be Discipline because discipline is the Key to Success in the STOCK Market.
Trade What you see not what you Think

Samvardhana Motherson International LtdMotherson Sumi Systems is primarily engaged in the manufacturing and sale of components for automotive original equipment manufacturers (OEMs).
Technically, the stock has shown a significant accumulation phase and has formed a complex head and shoulders pattern. While we are publishing this idea a bit late, I personally entered the position around the ₹140 mark after the initial breakout candle. Despite the delay, I believe there is still potential for the stock to reach around ₹240 in the near future.

MOTHERSON S/RSupport and Resistance Levels:
Support Levels: These are price points (green line/shade) where a downward trend may be halted due to a concentration of buying interest. Imagine them as a safety net where buyers step in, preventing further decline.
Resistance Levels: Conversely, resistance levels (red line/shade) are where upward trends might stall due to increased selling interest. They act like a ceiling where sellers come in to push prices down.
Breakouts:
Bullish Breakout: When the price moves above resistance, it often indicates strong buying interest and the potential for a continued uptrend. Traders may view this as a signal to buy or hold.
Bearish Breakout: When the price falls below support, it can signal strong selling interest and the potential for a continued downtrend. Traders might see this as a cue to sell or avoid buying.
20 EMA (Exponential Moving Average):
Above 20 EMA(50 EMA): If the stock price is above the 20 EMA, it suggests a potential uptrend or bullish momentum.
Below 20 EMA: If the stock price is below the 20 EMA, it indicates a potential downtrend or bearish momentum.
Trendline: A trendline is a straight line drawn on a chart to represent the general direction of a data point set.
Uptrend Line: Drawn by connecting the lows in an upward trend. Indicates that the price is moving higher over time. Acts as a support level, where prices tend to bounce upward.
Downtrend Line: Drawn by connecting the highs in a downward trend. Indicates that the price is moving lower over time. It acts as a resistance level, where prices tend to drop.
RSI: RSI readings greater than the 70 level are overbought territory, and RSI readings lower than the 30 level are considered oversold territory.
Combining RSI with Support and Resistance:
Support Level: This is a price level where a stock tends to find buying interest, preventing it from falling further. If RSI is showing an oversold condition (below 30) and the price is near or at a strong support level, it could be a good buy signal.
Resistance Level: This is a price level where a stock tends to find selling interest, preventing it from rising further. If RSI is showing an overbought condition (above 70) and the price is near or at a strong resistance level, it could be a signal to sell or short the asset.
Disclaimer:
I am not a SEBI registered. The information provided here is for learning purposes only and should not be interpreted as financial advice. Consider the broader market context and consult with a qualified financial advisor before making investment decisions.

MOTHERSON paper trade ideas for Swing18.09.2024 Swing trade
Buy- 210
Target-260
Stop Loss-181
Risk Reward- 1:7
#papertrade #learningonly #Swing trade
1.Breakout- Down trend break out @197
2.KeyLevel- At resistance
4.Volume- Volumes increasing in bullish & good volumes in breakout candle
5. EMA- 50 support on day candle
6. RSI-Bullish
7. Chart Petter- W Pattern formation. Expected to give good move
New : REE Automotive raises $45 mln, announces partnership with Motherson Group
Indian auto parts maker Motherson to launch $715 million share sale, sources say
